Account access and review
See cloud access status and request a review if access is paused.
Watch exampleProduct catalog
Explore the tools you can use to work with data, draw diagrams, and share what you build.
Try a shorter search or use a term such as CSV, voice, or diagram.
11 features
See cloud access status and request a review if access is paused.
Watch exampleSend finalized phrases after a pause.
Watch exampleTalk to the crew in shared Analytics and Design conversations.
Watch exampleAsk a specialist one-on-one.
Watch exampleReview specialist roles and customize how they talk.
Watch exampleOpen the local specialist crew for data, analysis, and design.
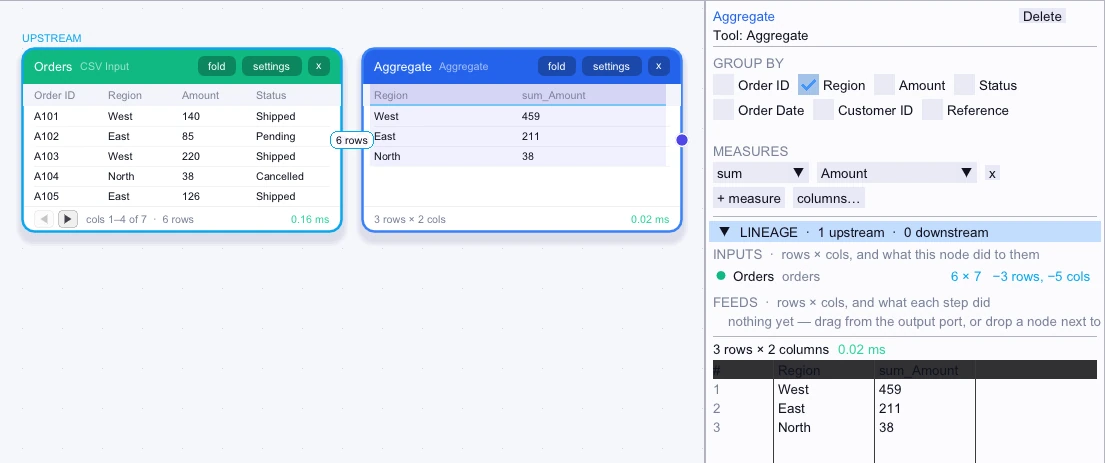
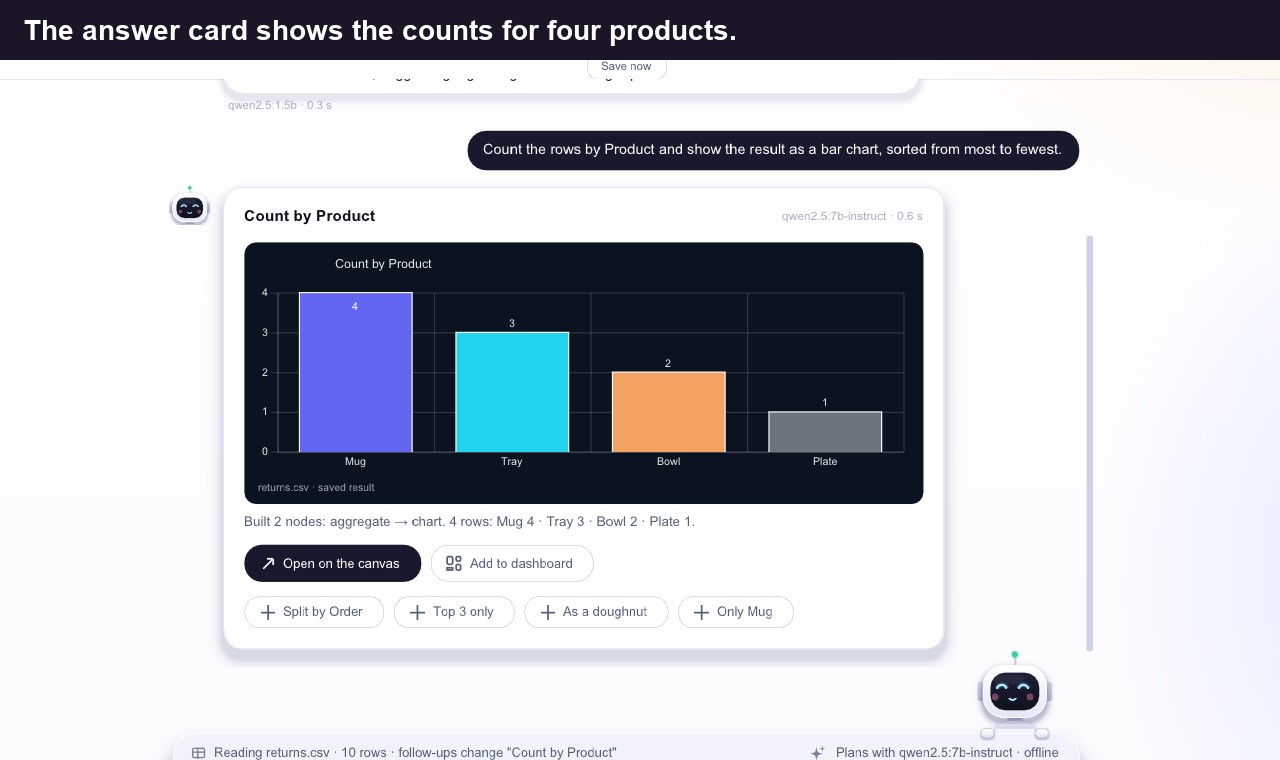
AppWatch exampleGroup rows by category and calculate summaries.
Canvas nodeSee workflowsPlan analytical pipelines.
Watch exampleUse a recorded WAV to try the transcription path and review the resulting text.
Watch exampleRoute new local files to the appropriate specialists.
Watch exampleUpdate affected steps when data or settings change.
Watch example7 features
Keep using the app and see progress while a CSV loads.
Watch exampleCompare measures across categories.
Watch exampleReuse public Evals charts through embed code, SVG, or JSON.
Watch exampleReview repeated measurements and their changes over time.
Watch exampleInspect measurement conditions and evidence.
Watch exampleOrganize several boards, archive closed tabs, and reopen them later.
Watch exampleAuthorize desktop sign-in from a verified browser session.
Watch example26 features
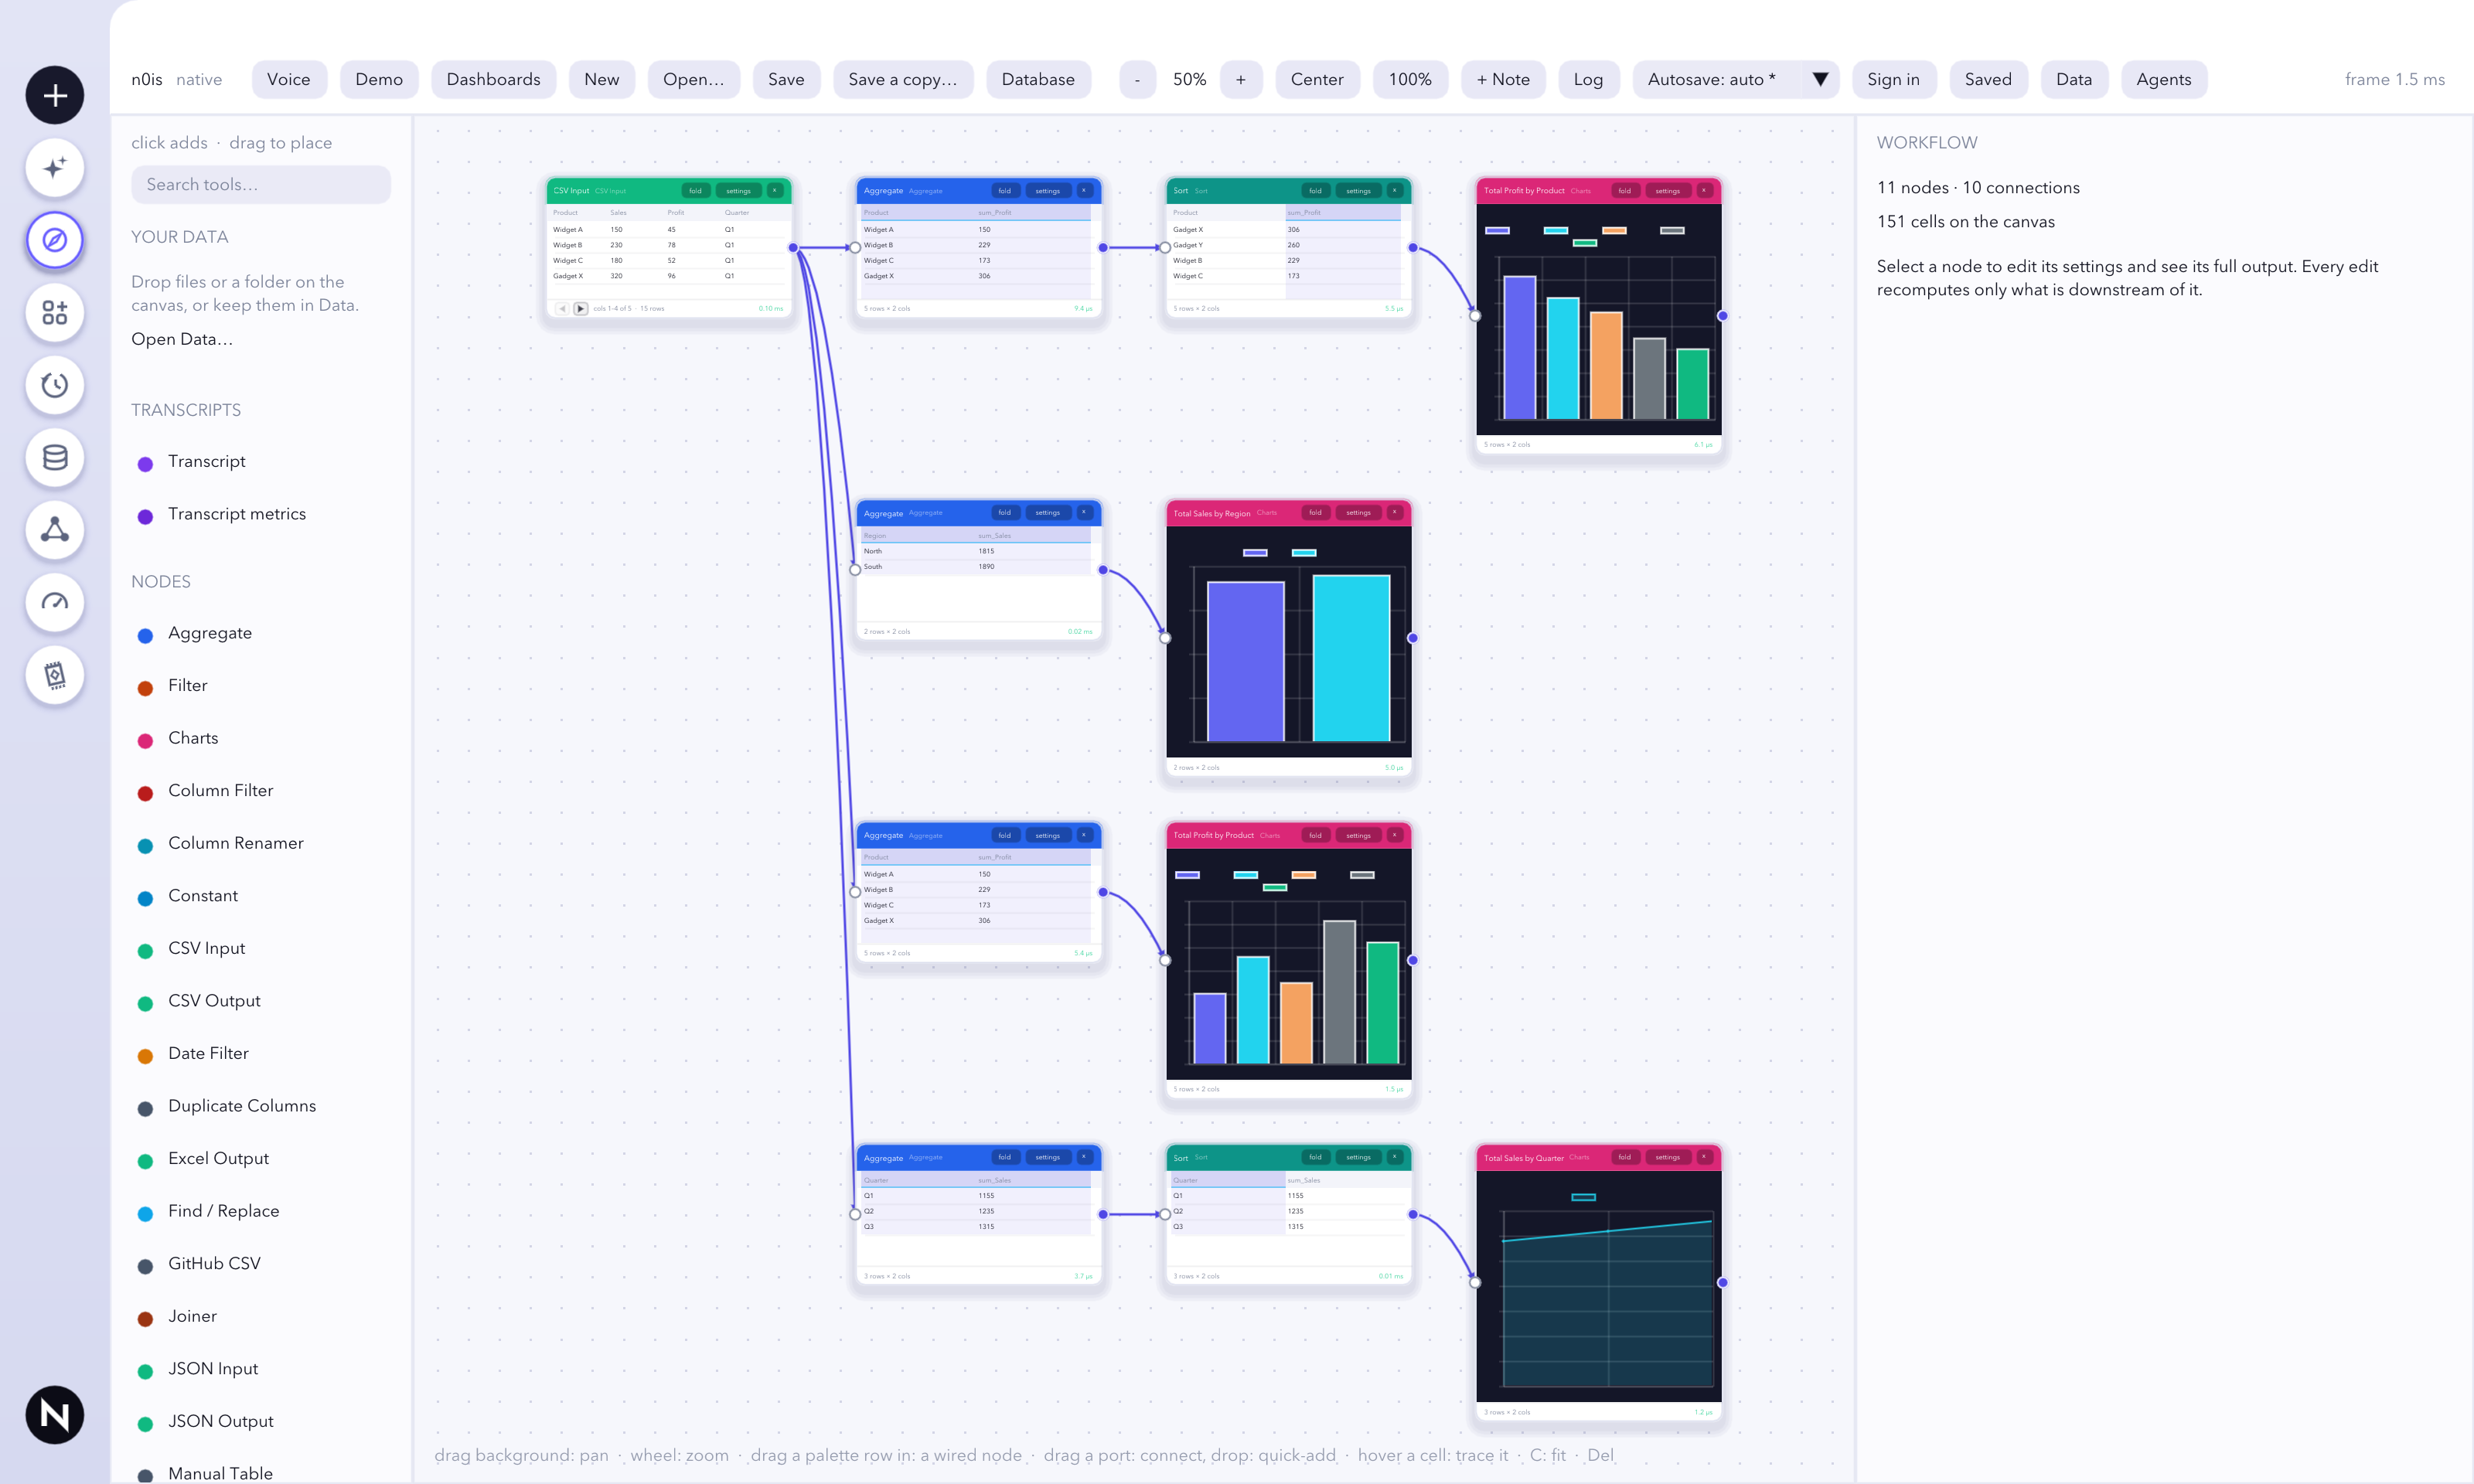
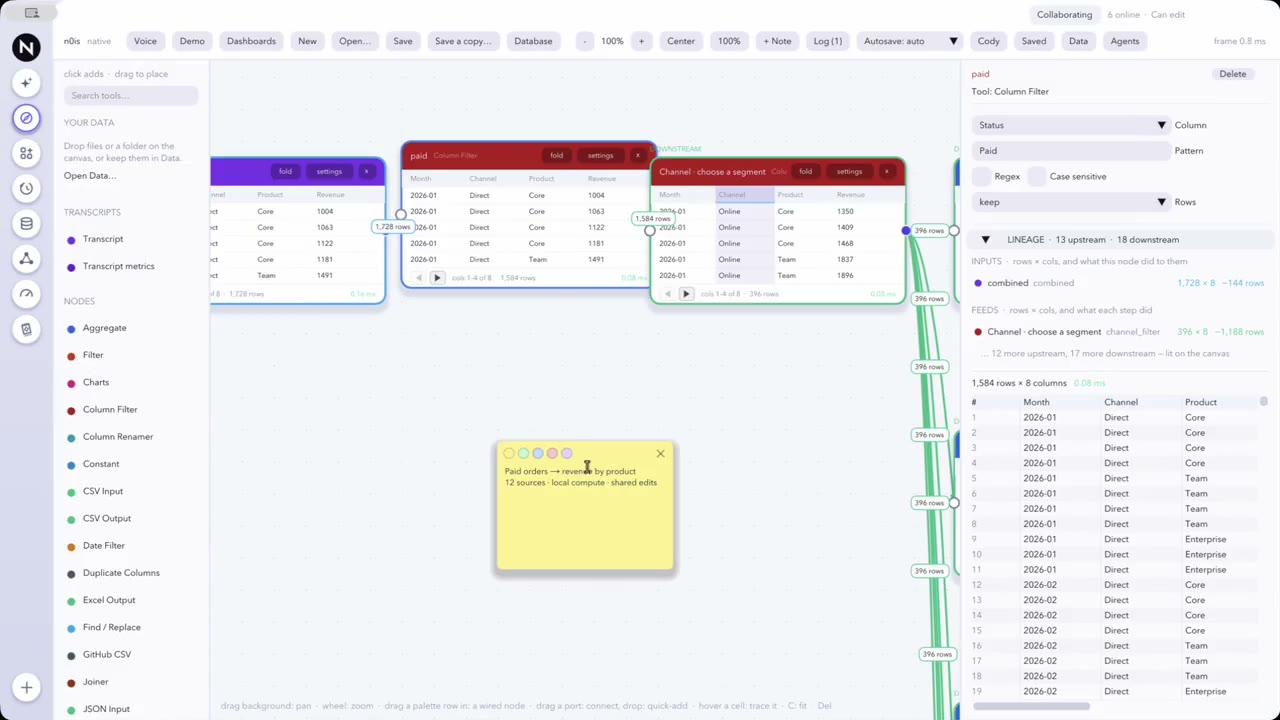
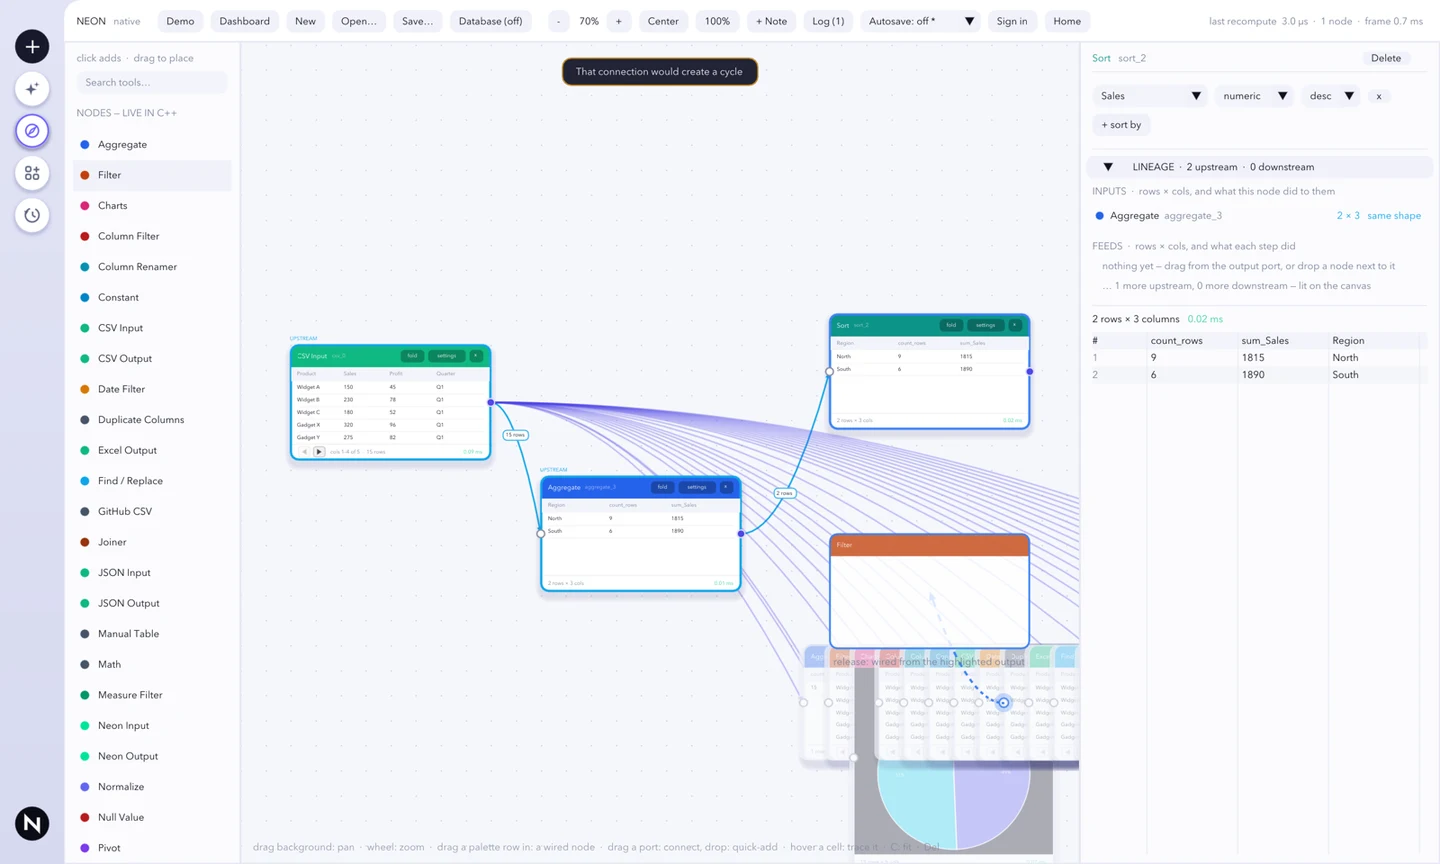
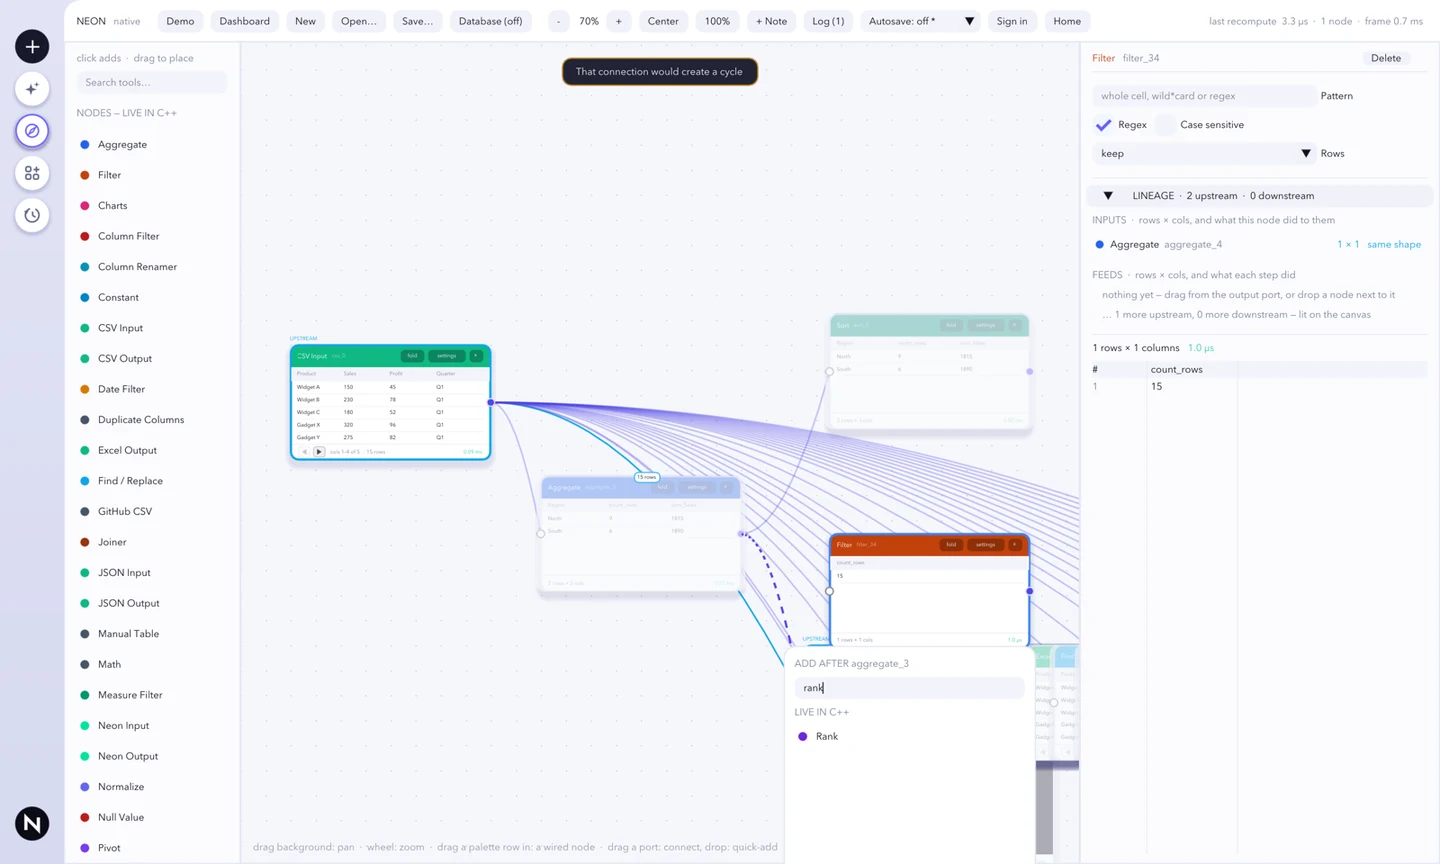
Build visual data workflows from sources, transformations, charts, and outputs.
AppWatch examplePlace a text comment at a specific point on a shared board.
Watch exampleLink a specific board object in studio chat.
Watch examplePin local visual evidence beside a workflow.
Watch examplePan, zoom, center, and fit a workflow.
Watch exampleMove, resize, and remove cards to arrange a studio.
Watch exampleCreate a new version of a supported card while keeping the original.
Watch exampleLeave annotations next to workflow steps.
Watch exampleFollow matching values between connected steps.
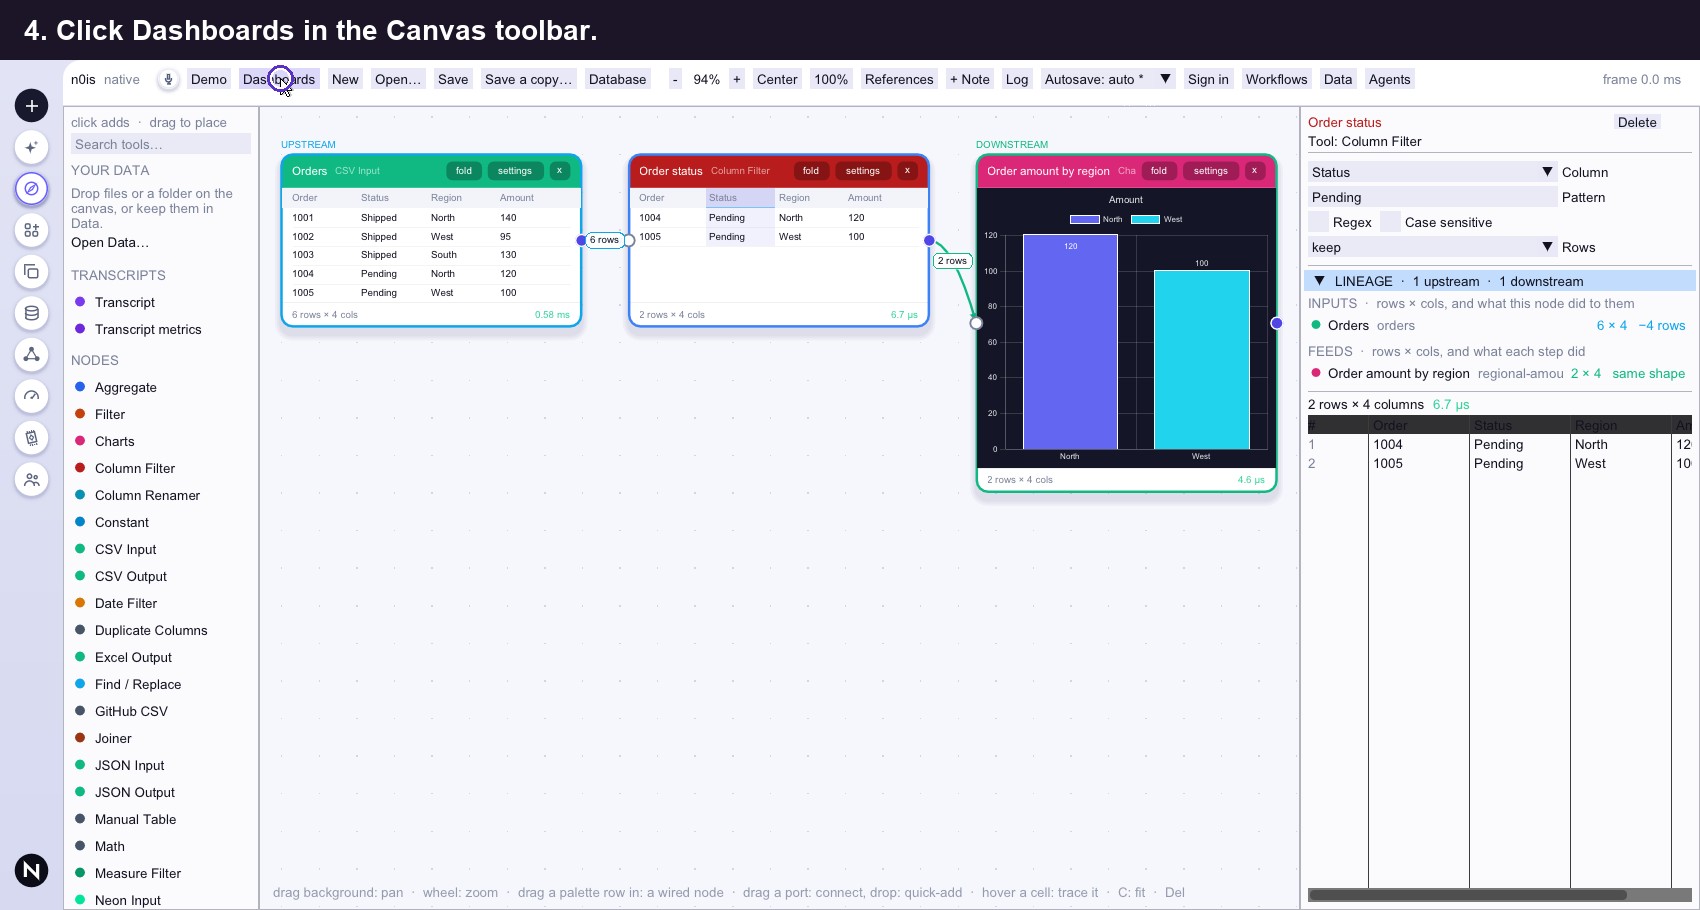
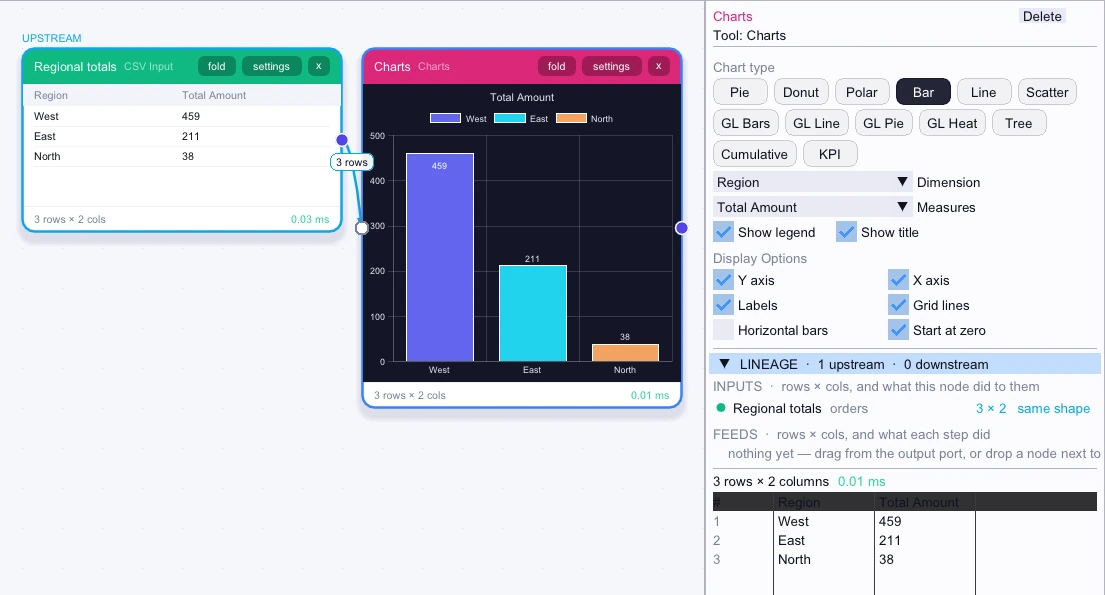
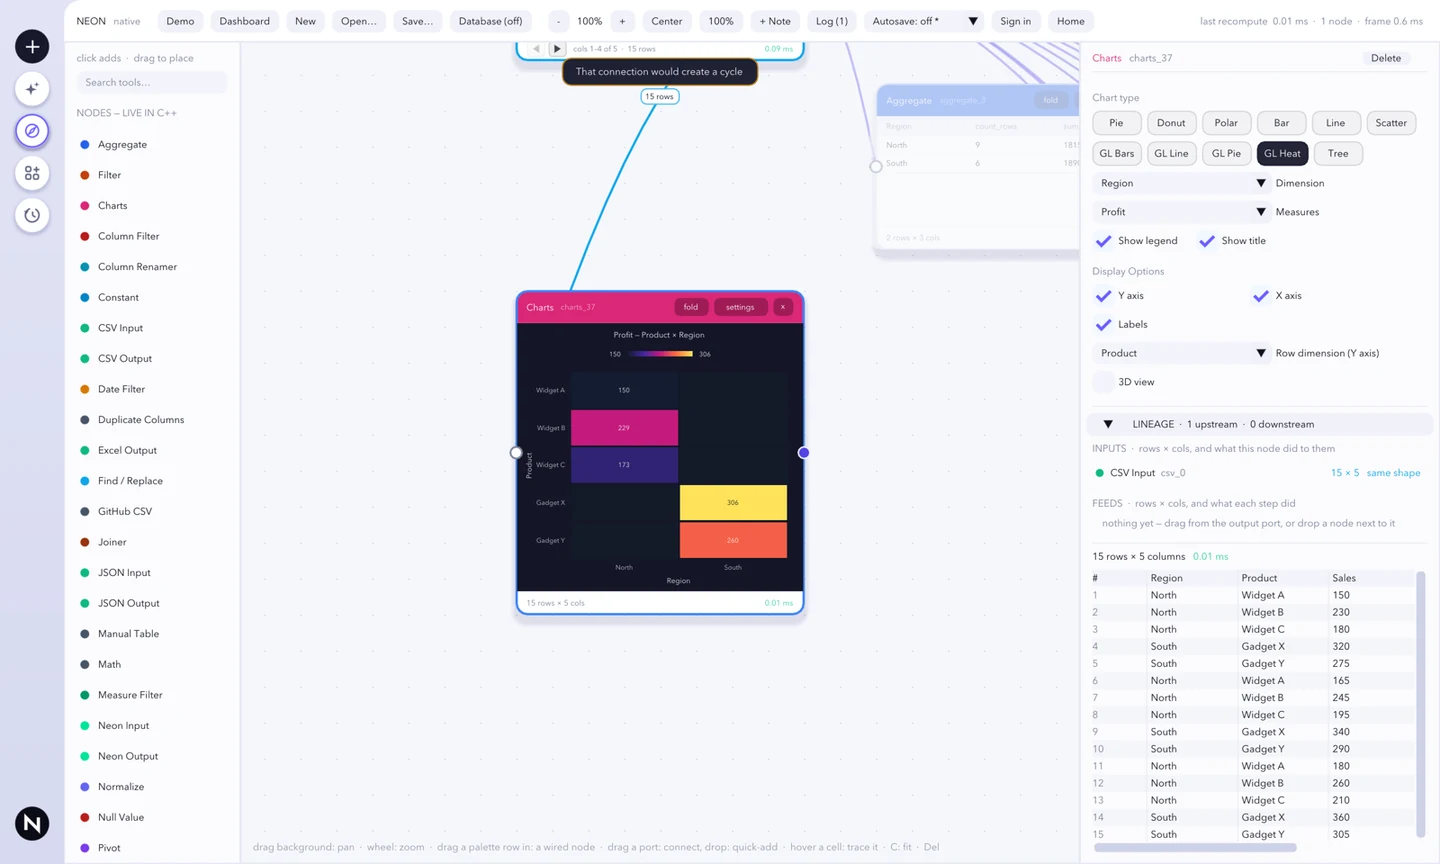
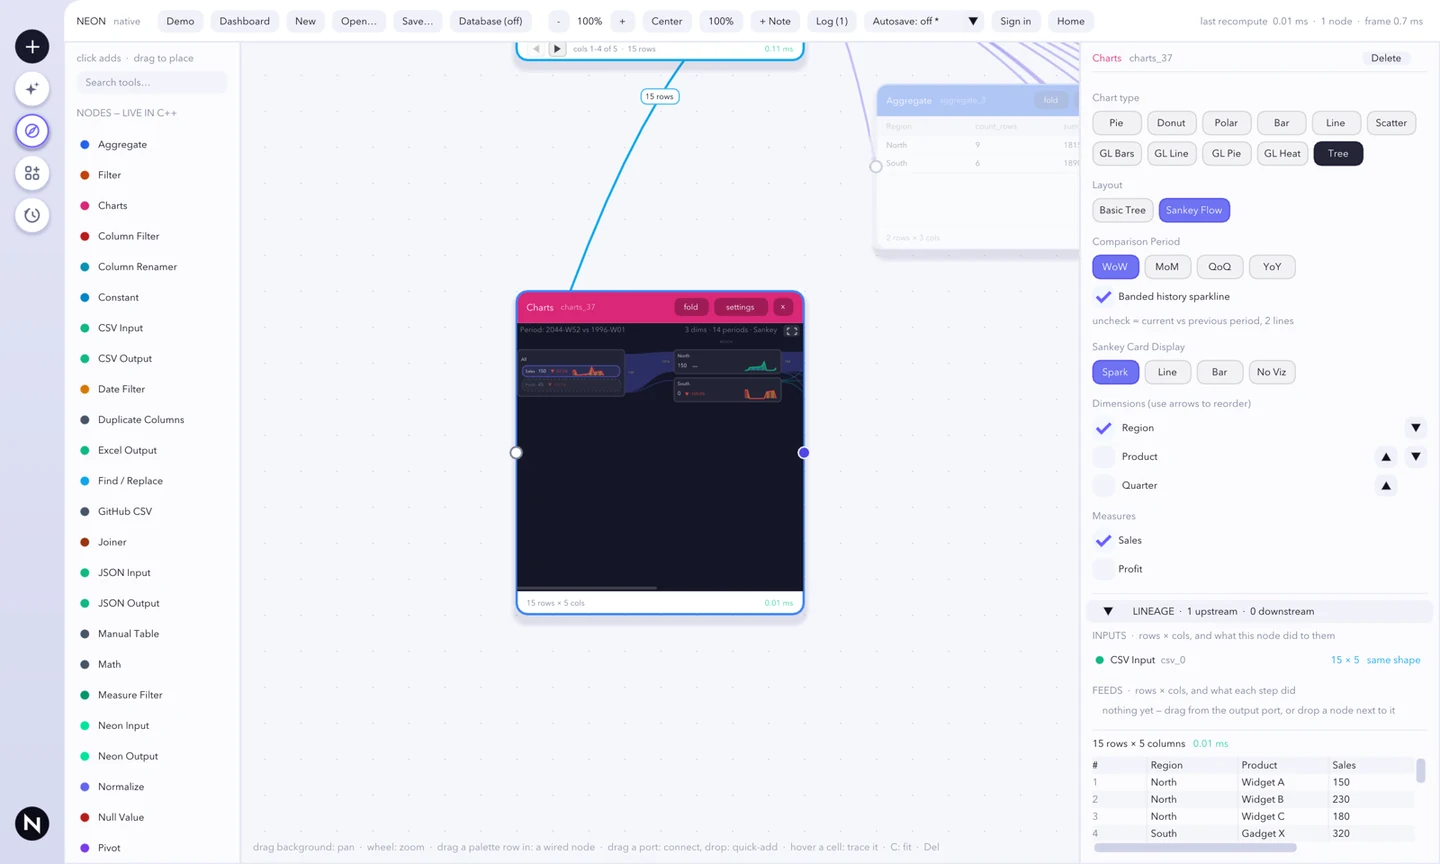
Watch exampleTurn pipeline data into charts, trees, or KPI cards.
Canvas nodeSee workflowsResolve uncertain transcript interpretations with Mouse.
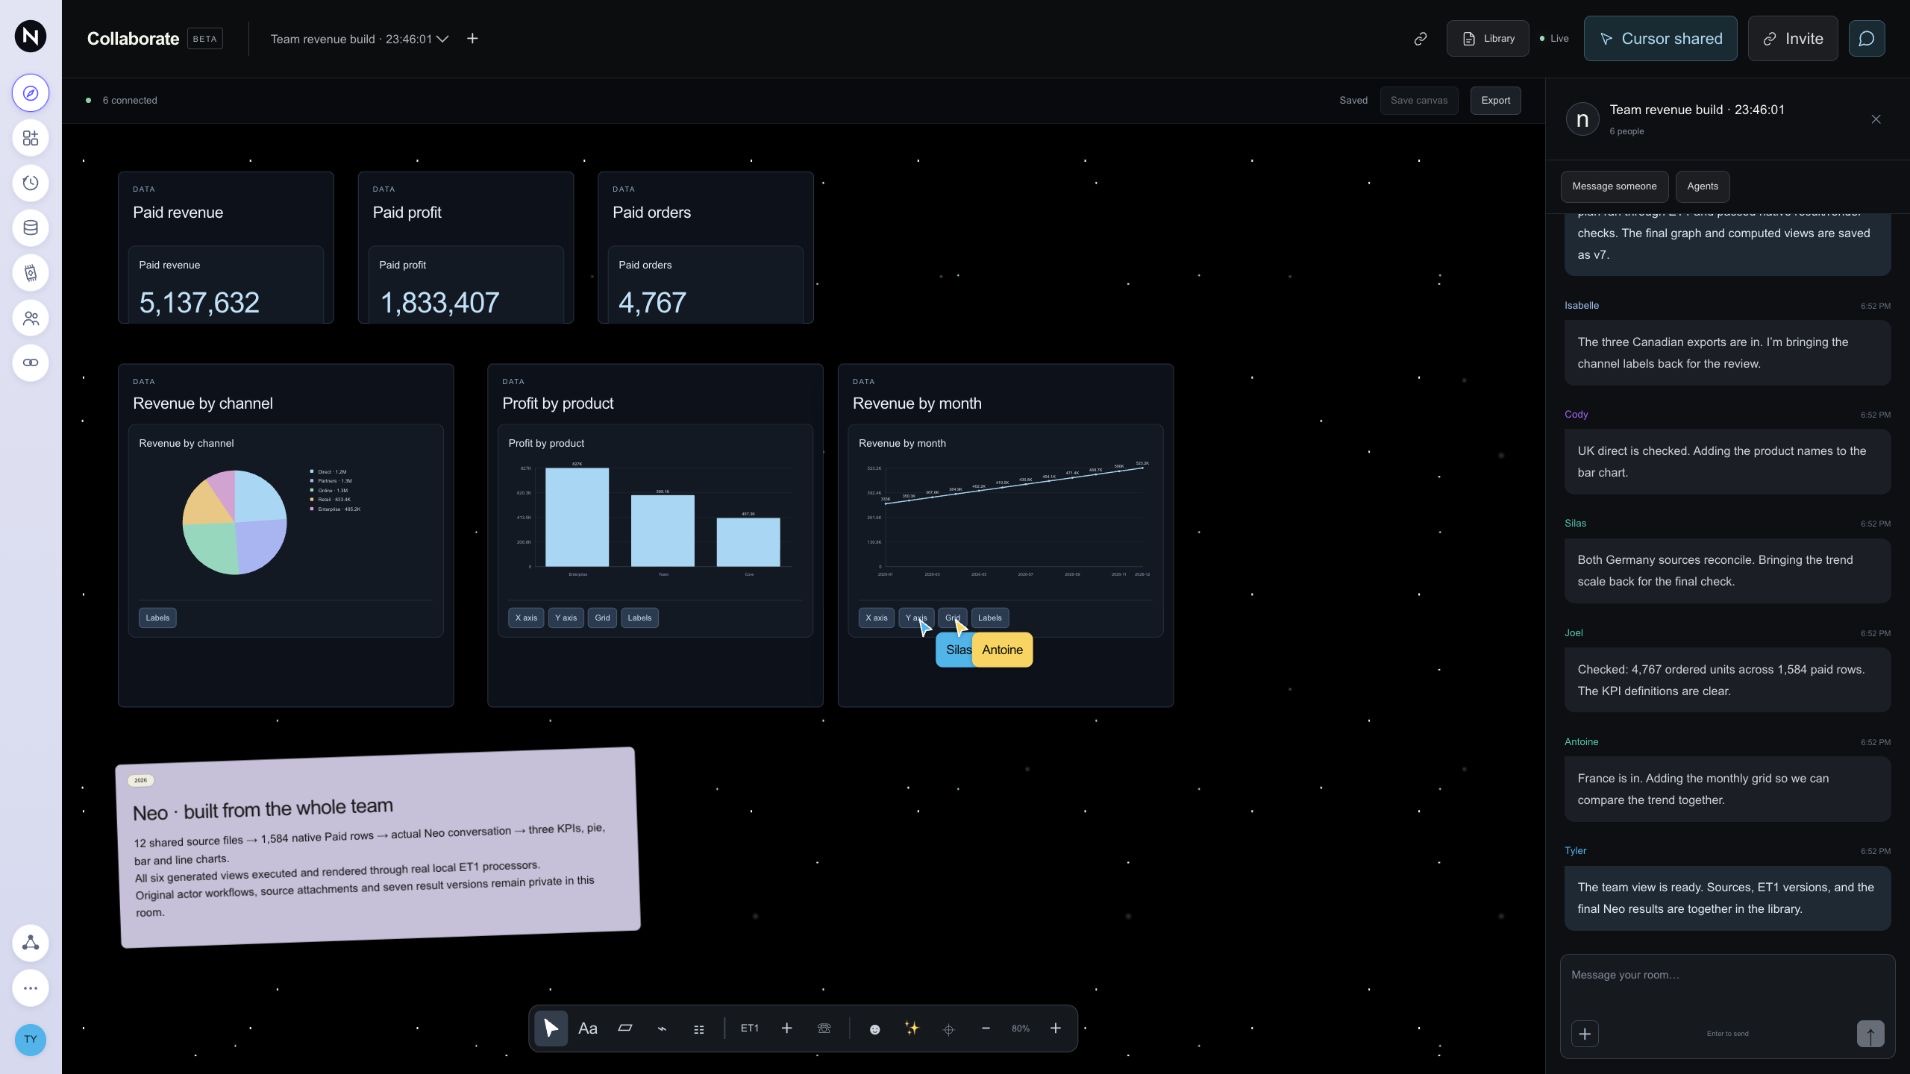
Watch exampleWork with your team in a shared studio.
AppWatch exampleFold a section of the graph while preserving its wiring.
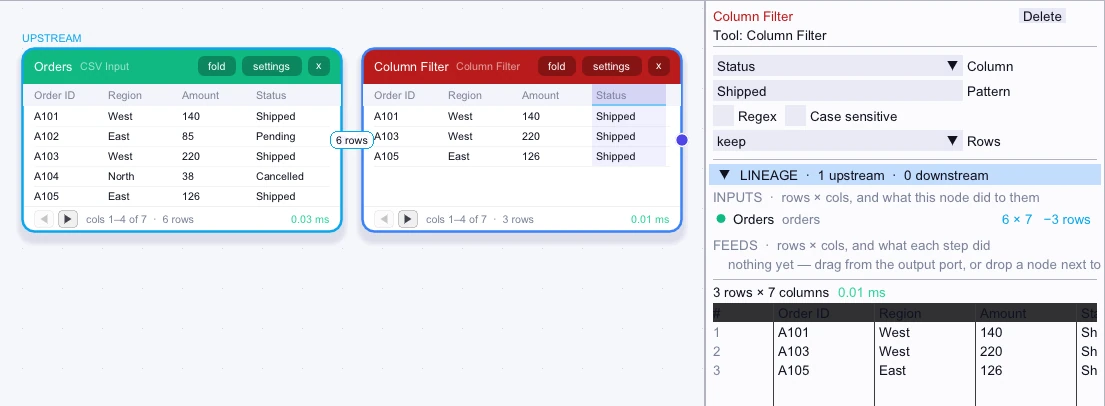
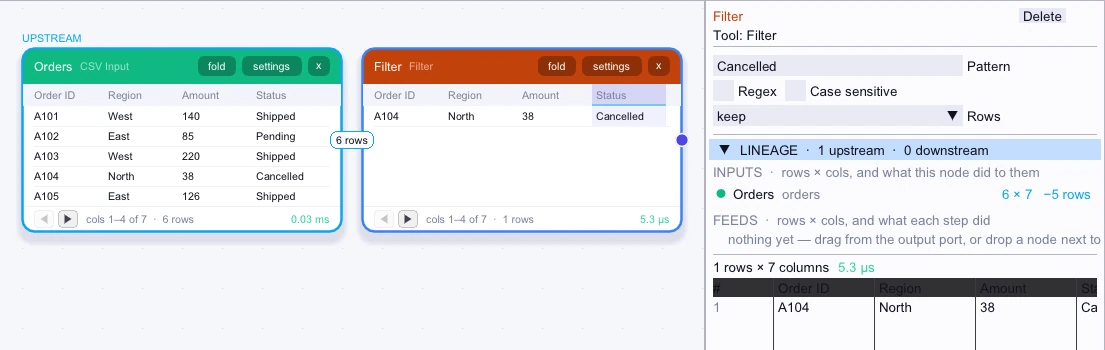
Watch exampleKeep or remove rows based on a pattern in one column.
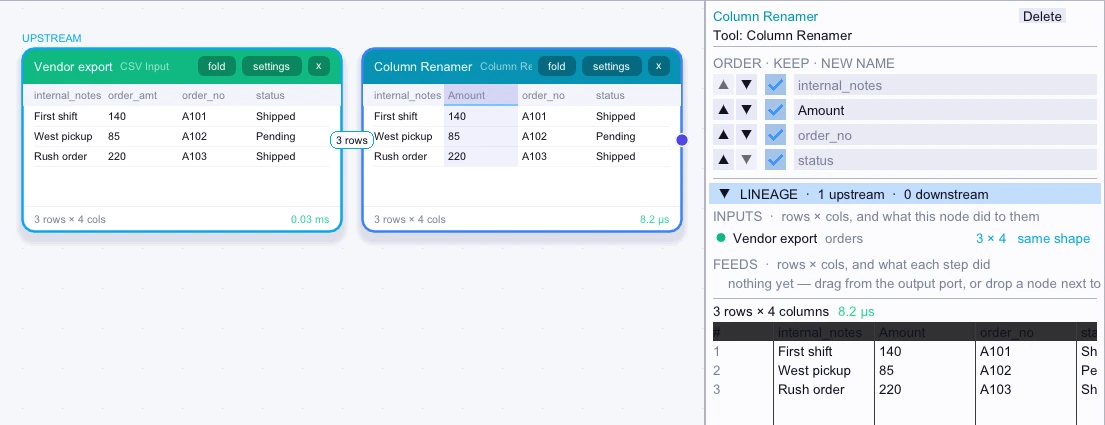
Canvas nodeSee workflowsRename, reorder, or remove columns.
Canvas nodeSee workflowsBring topic diagrams, word networks, and optional passages into one connected Rug board.
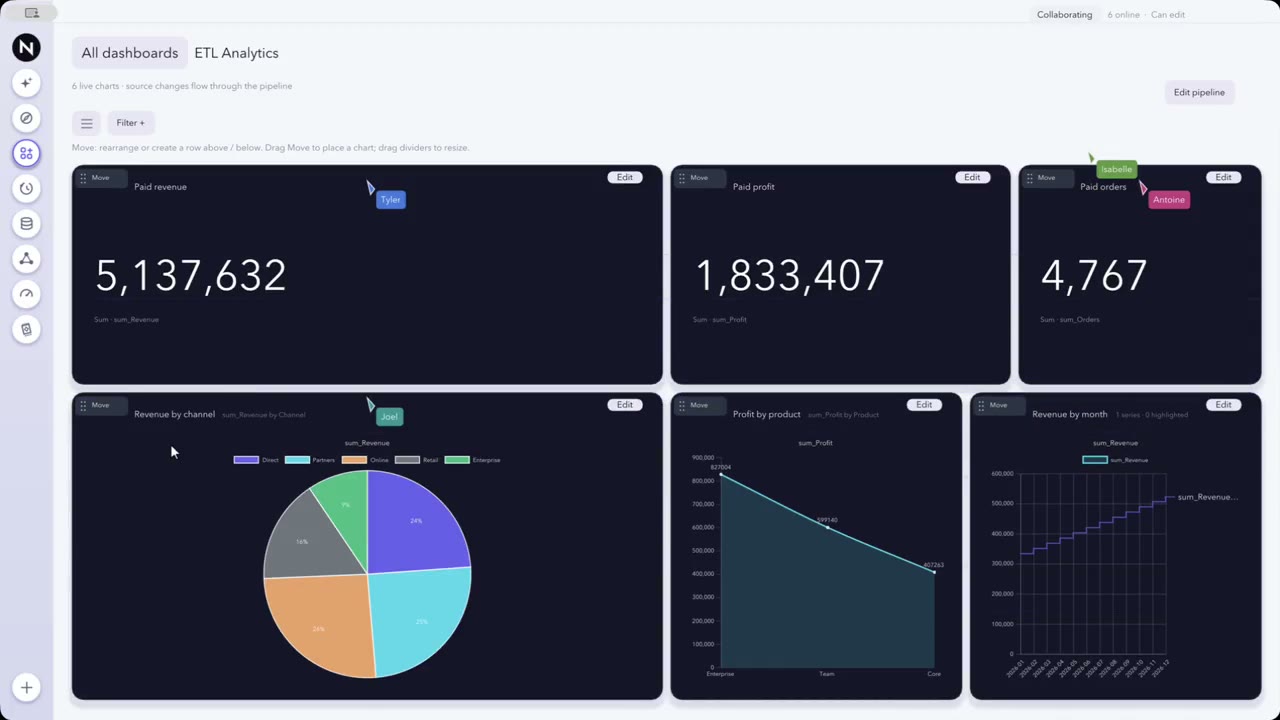
Watch exampleShare a dashboard with its charts, tables, and metrics together.
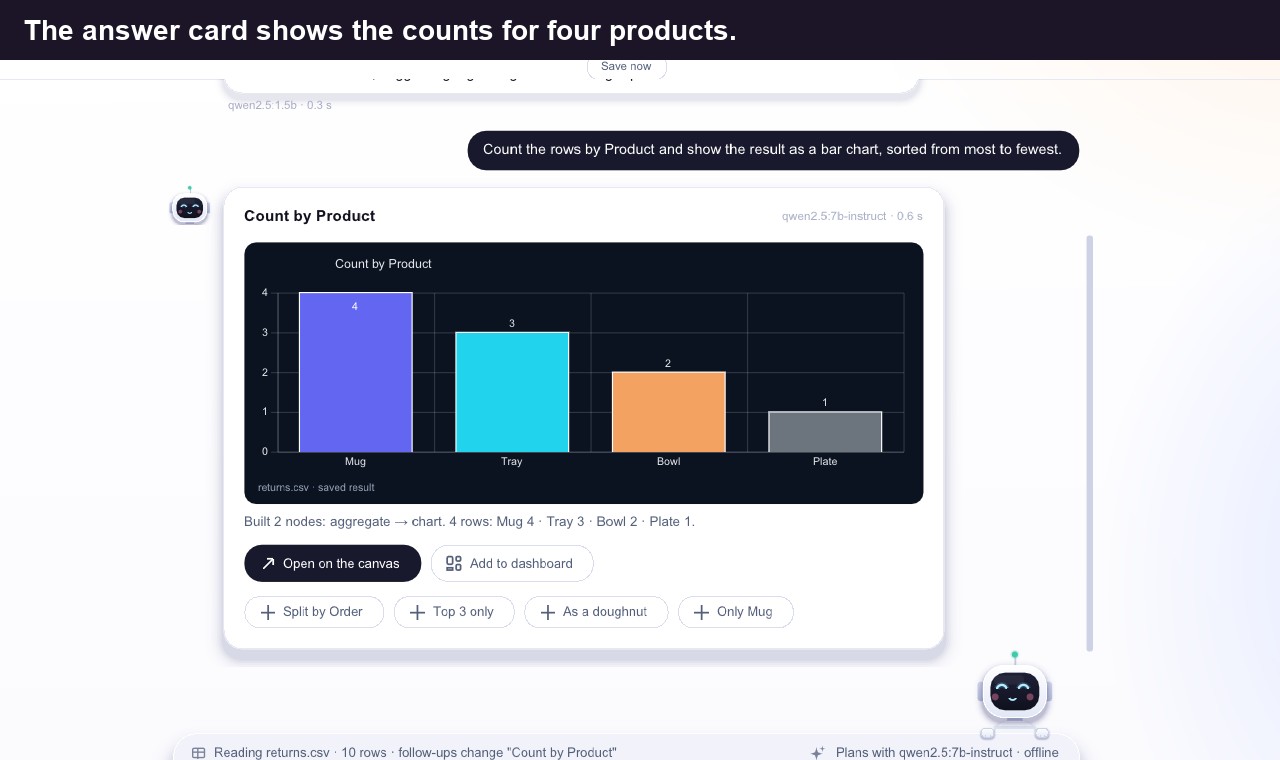
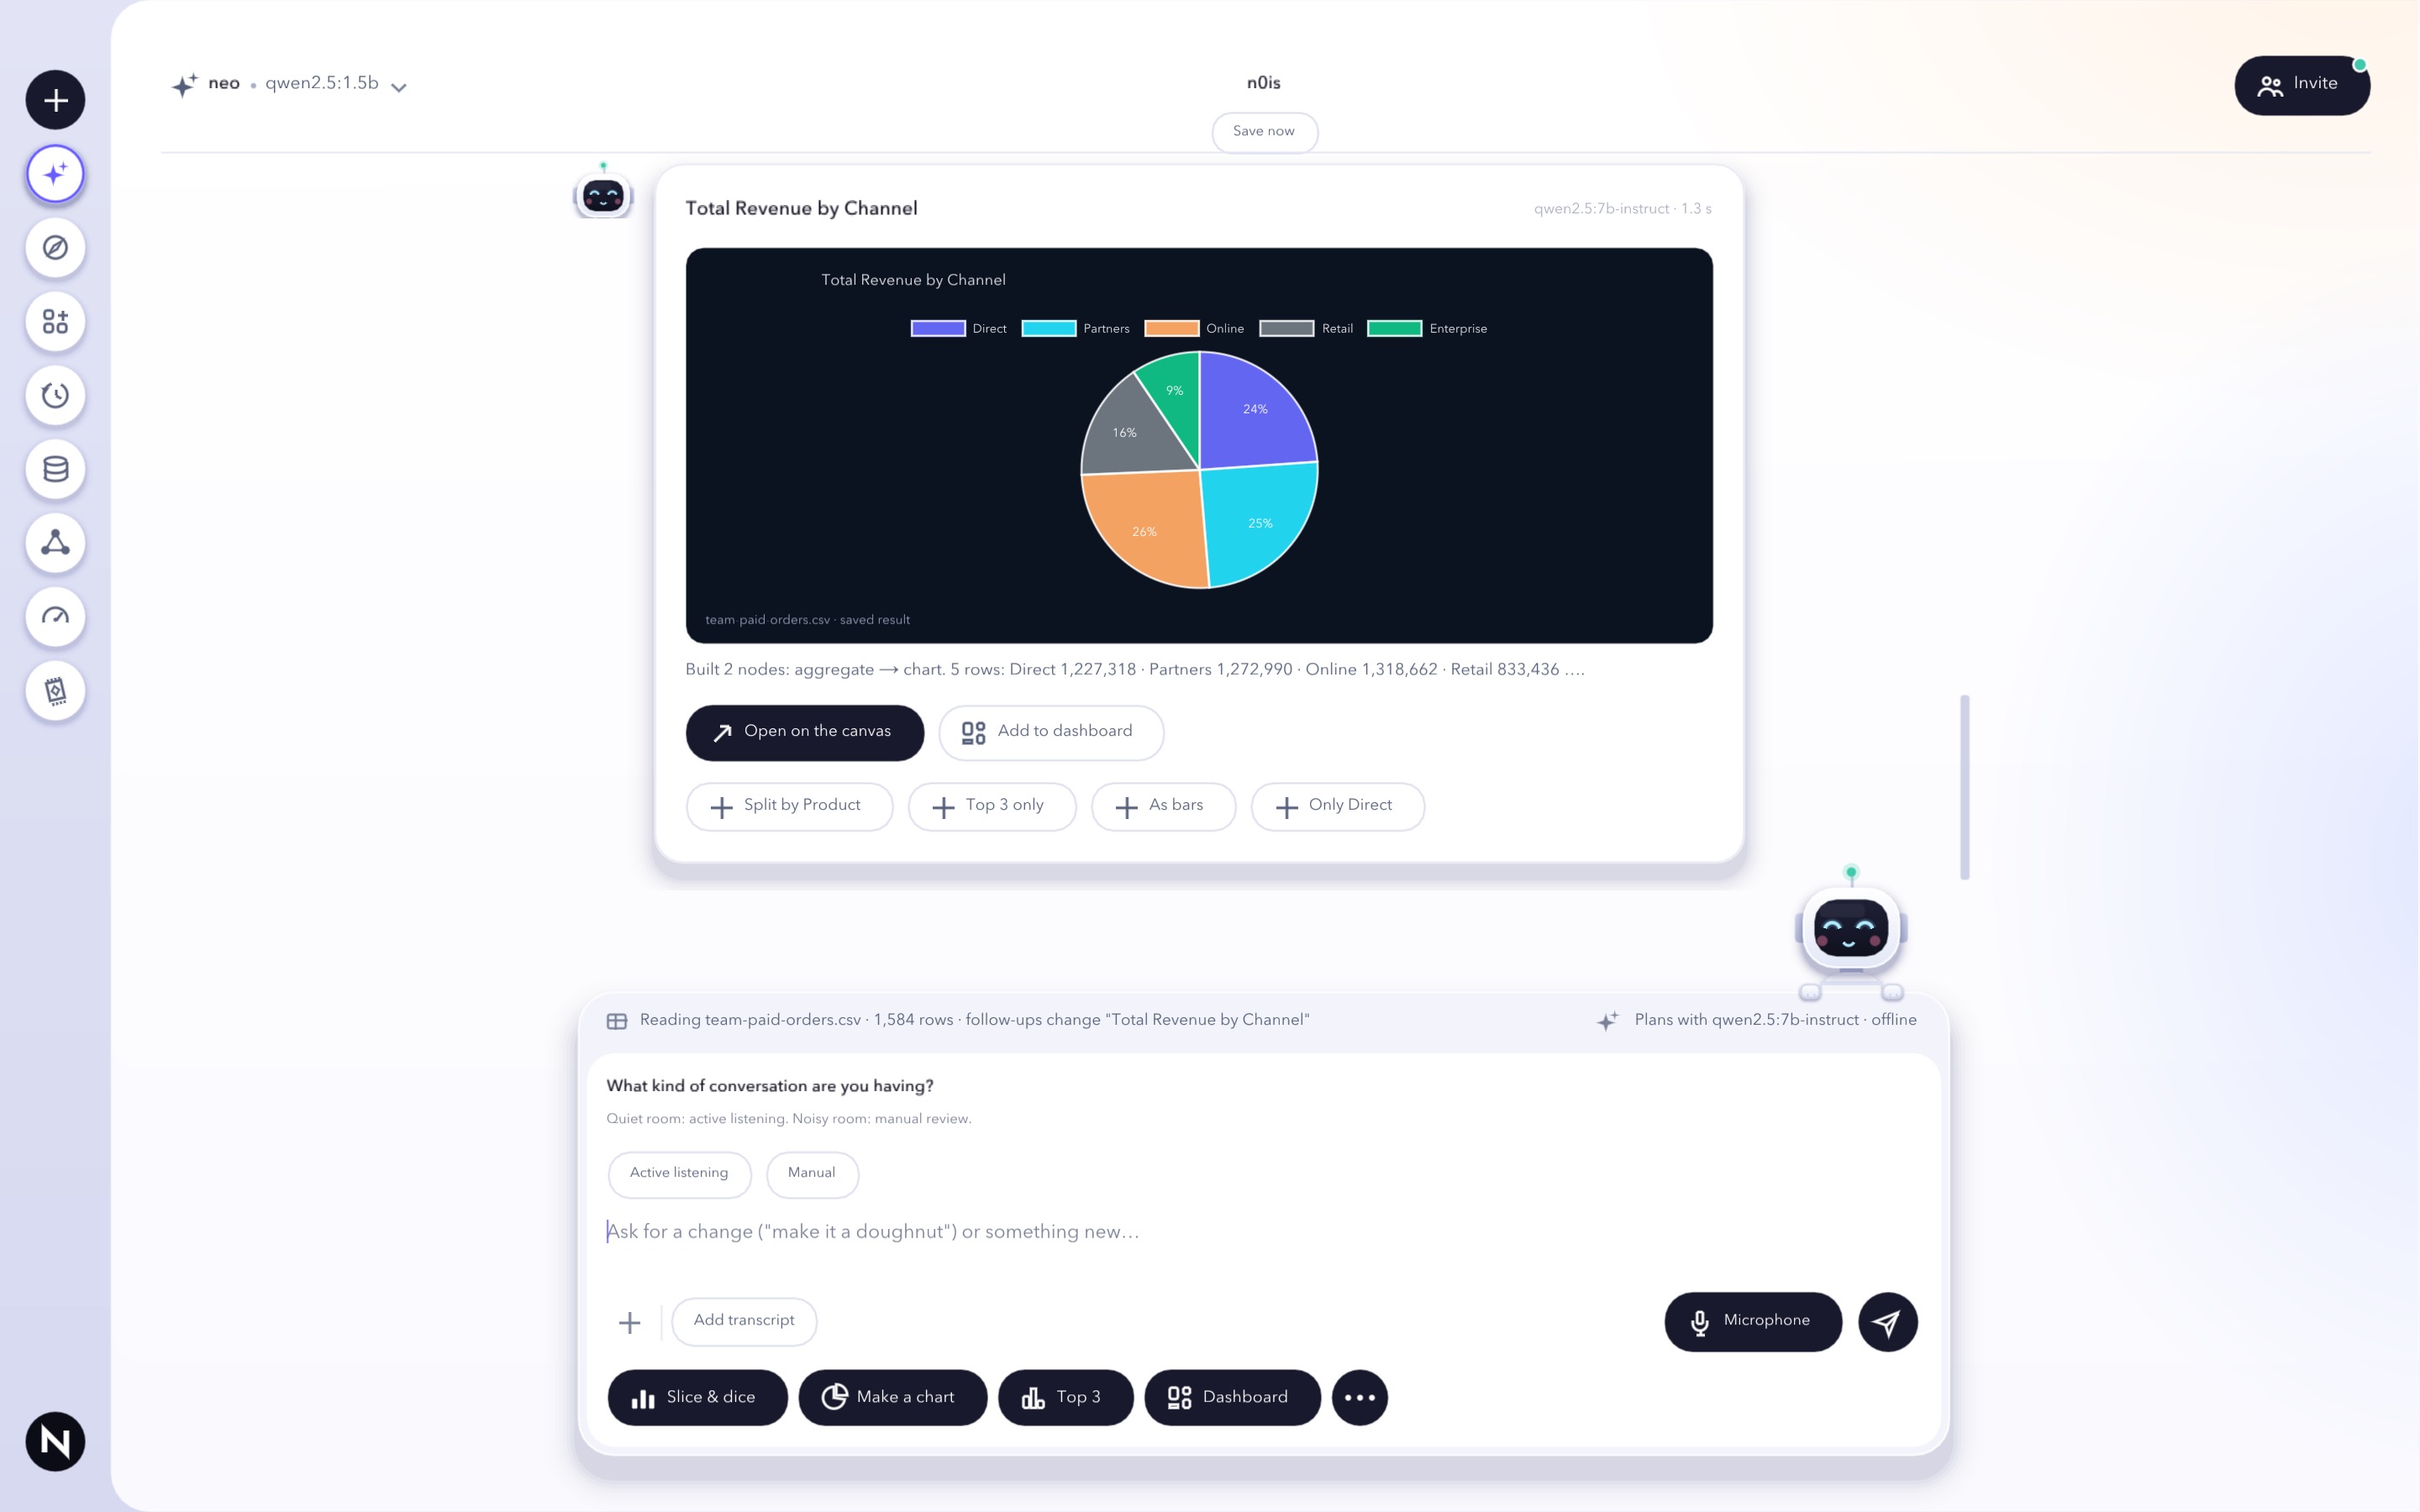
Watch exampleSee the engine's results as a chart, table, or summary in chat.
Watch exampleSet line patterns and endpoints, and label a connector along its curve.
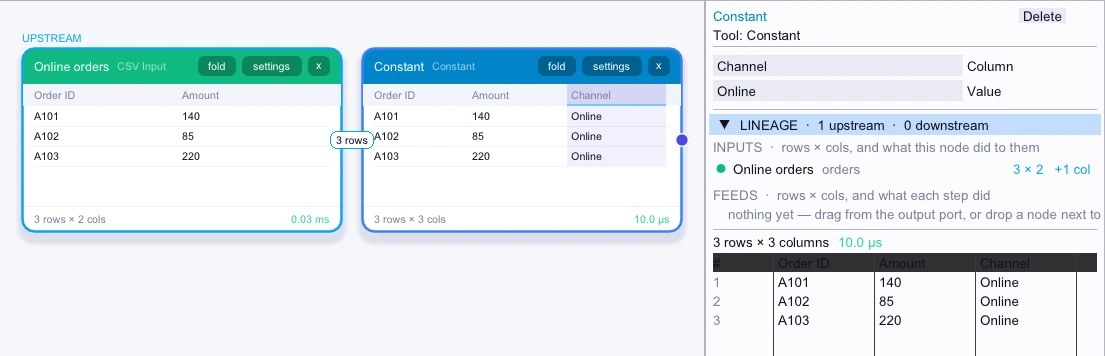
Watch exampleFill a column with the same value in every row.
Canvas nodeSee workflowsRefine a result with a follow-up request while preserving the previous result until the update completes.
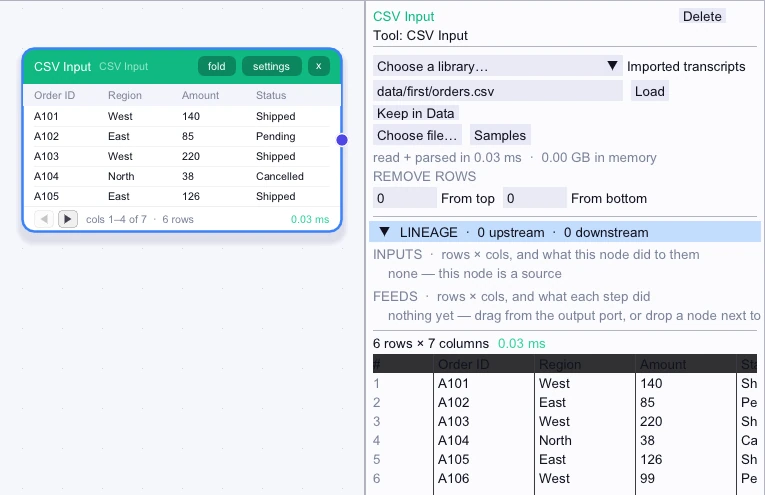
Watch exampleLoad a delimited file or an imported transcript library.
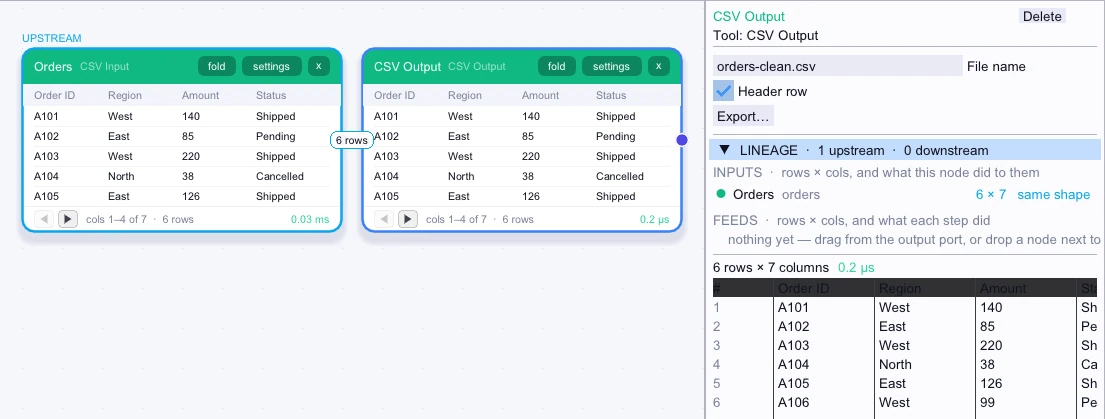
Canvas nodeSee workflowsExport connected data as a CSV file.
Canvas nodeSee workflowsFollow totals as they accumulate over a series.
Watch exampleChoose a pointer, hand, crosshair, or emoji and personalize its appearance.
Watch exampleAttach arrows to shapes and reconnect or detach their ends.
Watch example21 features
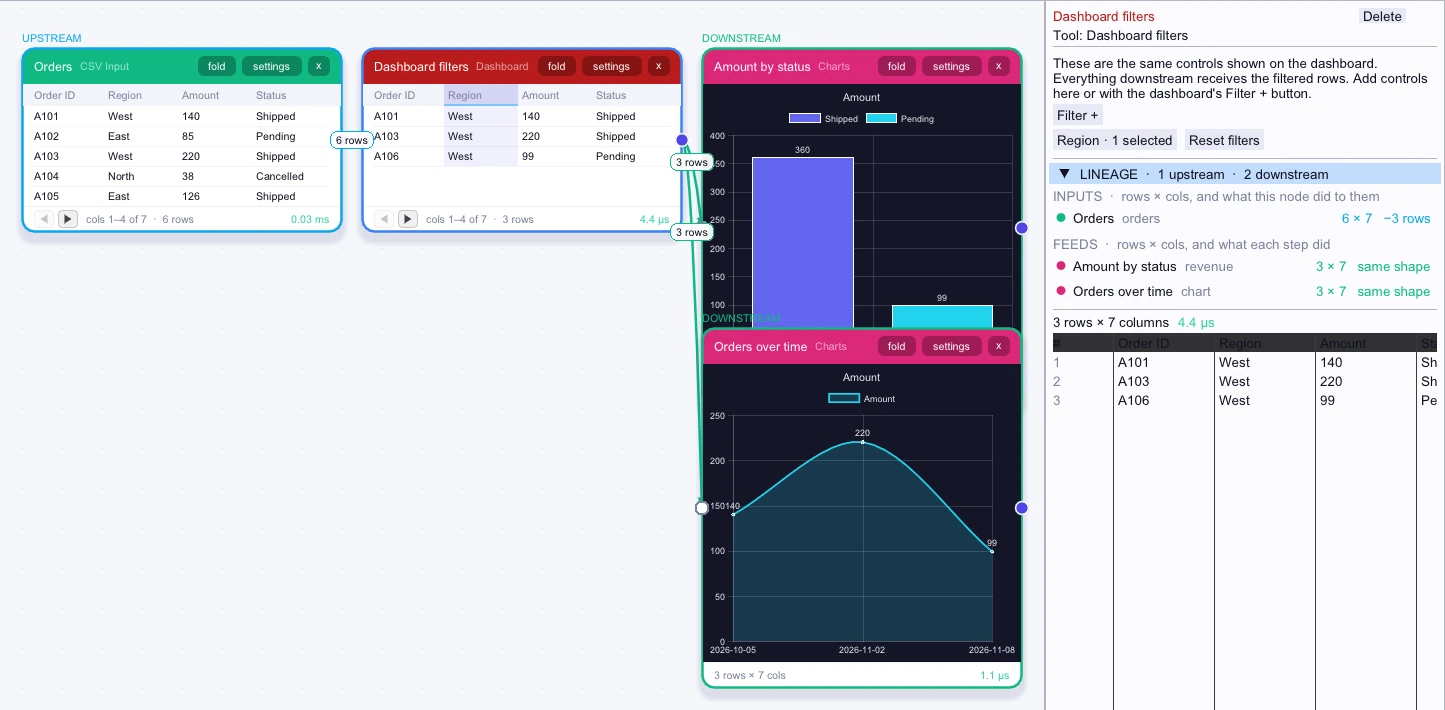
Filter dashboard charts together and apply the same selections to connected workflow steps.
Canvas nodeSee workflowsMove and resize chart and KPI cards.
Watch exampleReread sources manually or on a timer.
Watch exampleBrowse and preview dashboards across workflows and transcript collections.
AppWatch exampleKeep a local library of data sources.
AppWatch exampleSee relationships across compatible local tables.
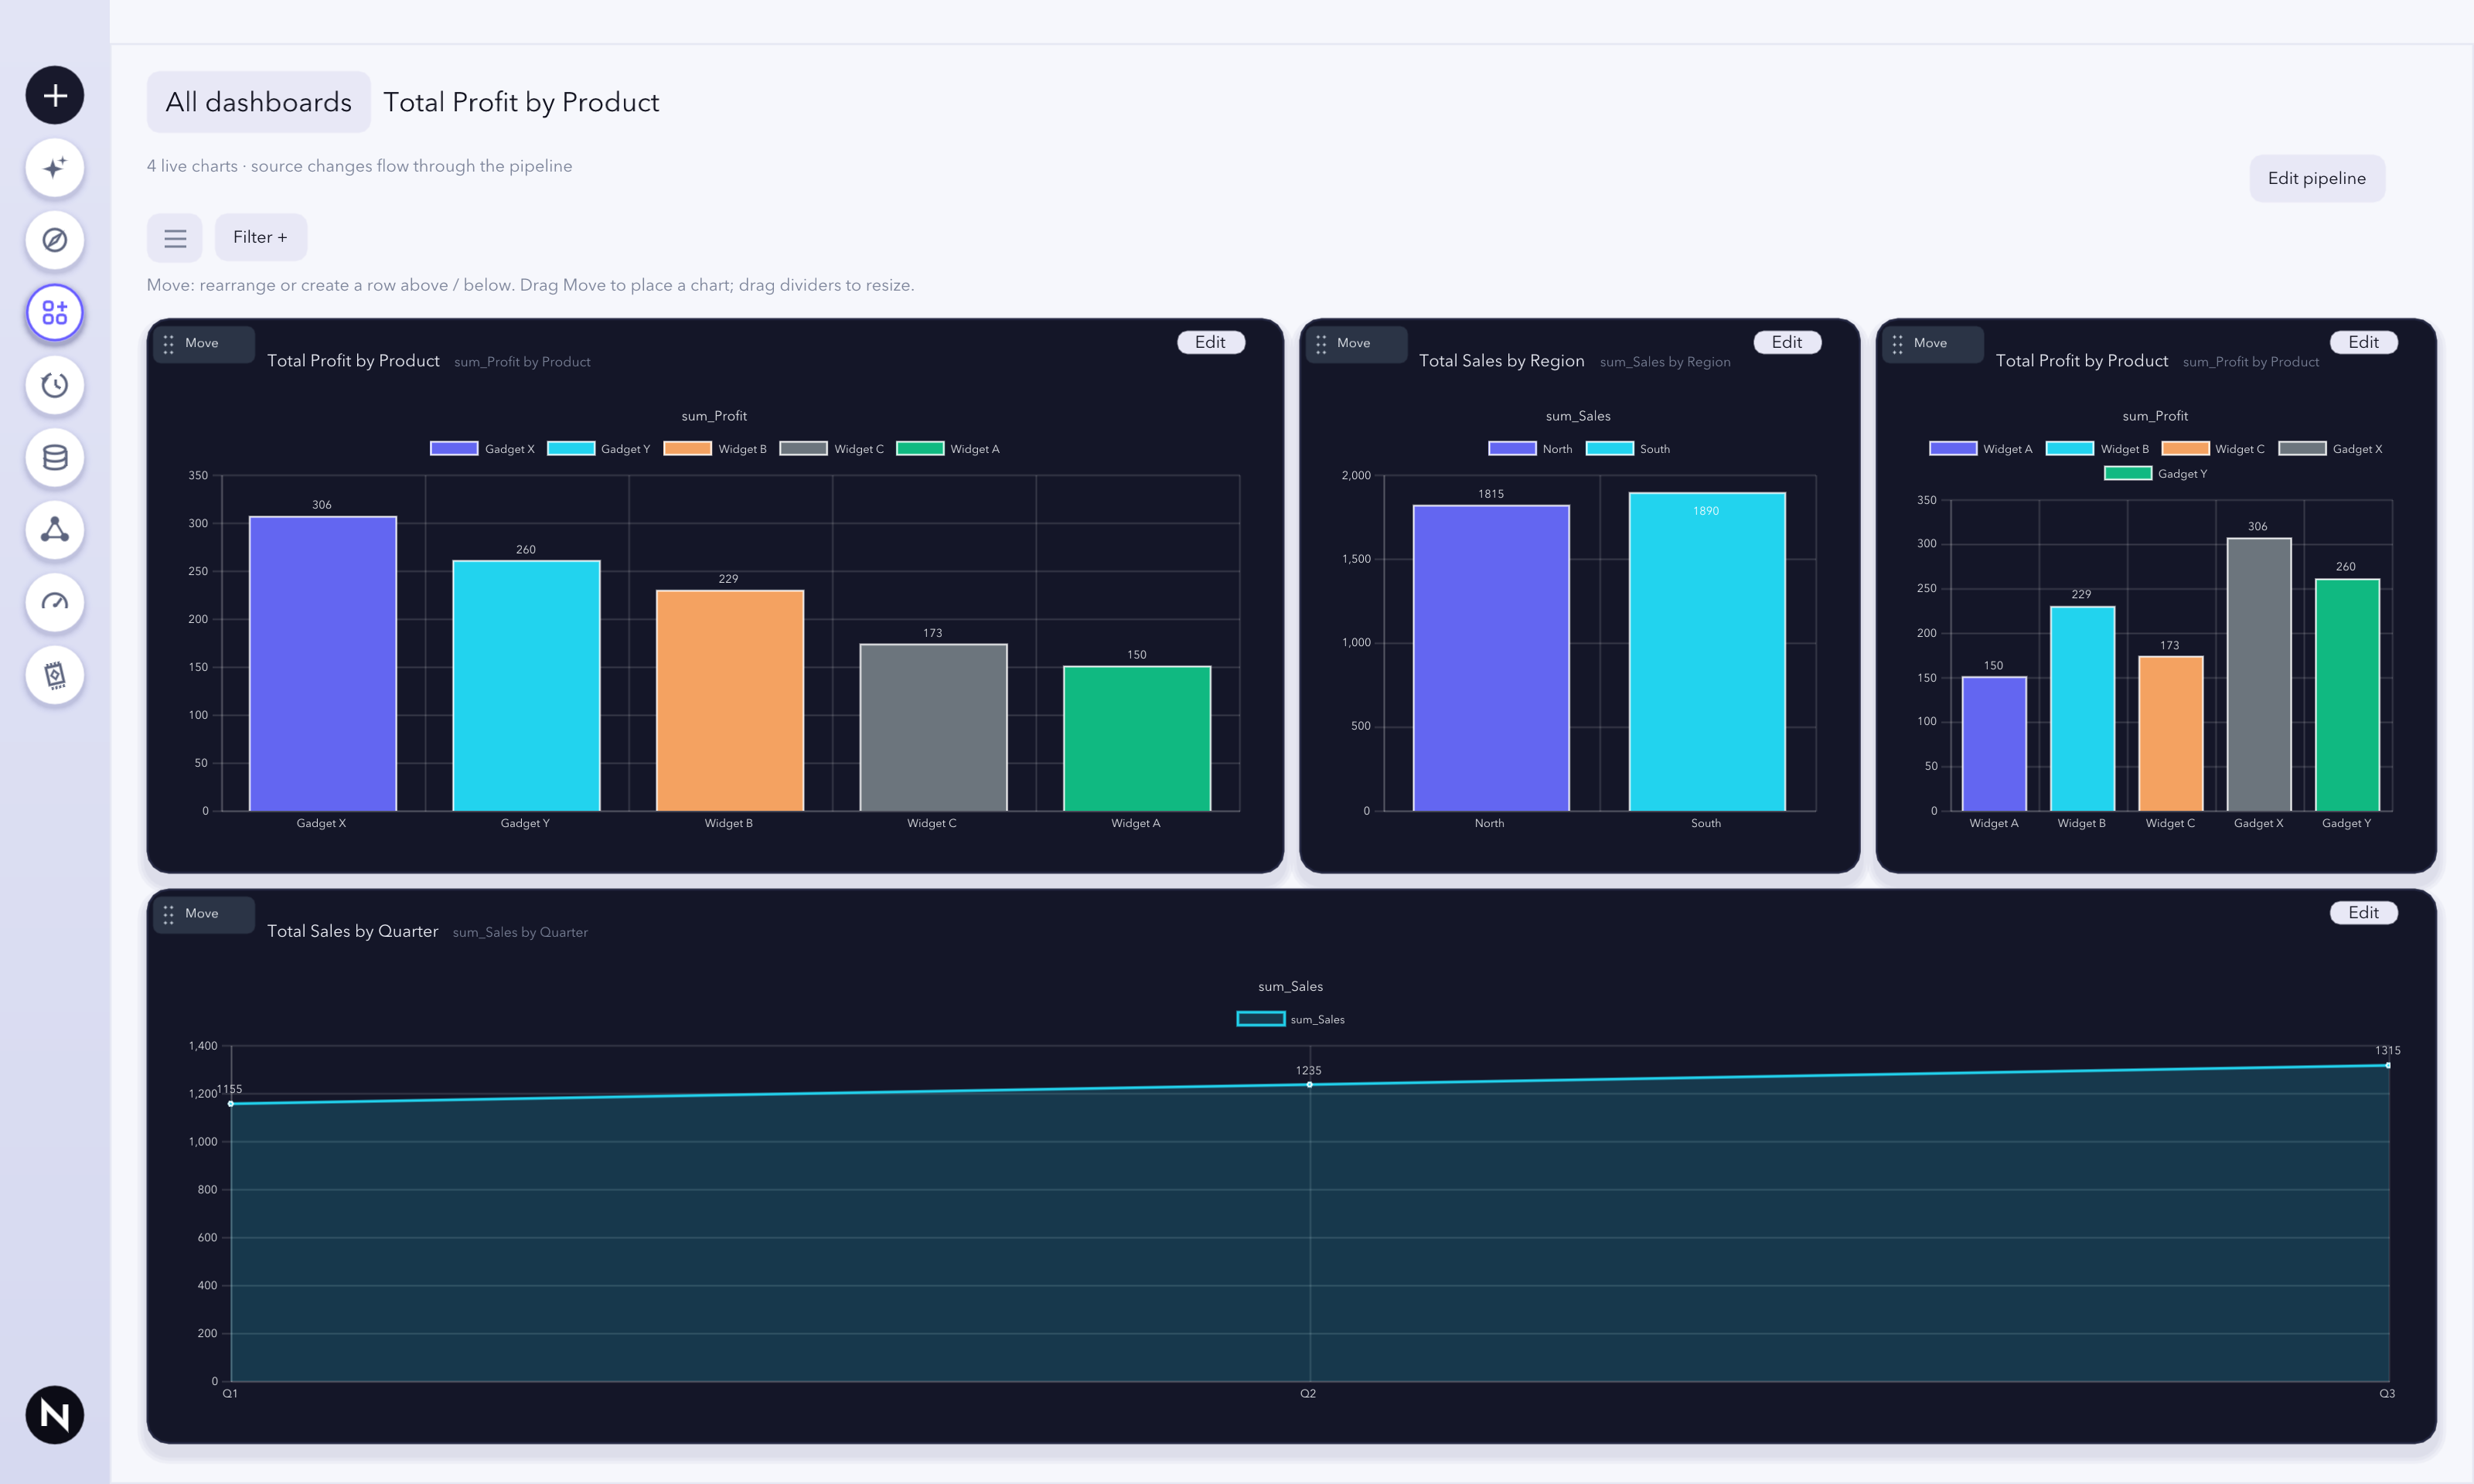
Watch exampleTurn a dataset into saved charts and KPIs.
Watch exampleSee row and column counts and inspect what a dataset contains.
Watch exampleFind data by file, purpose, column, or source group.
Watch exampleStart from a file in Data or use a named source, schema match, or offered source in chat.
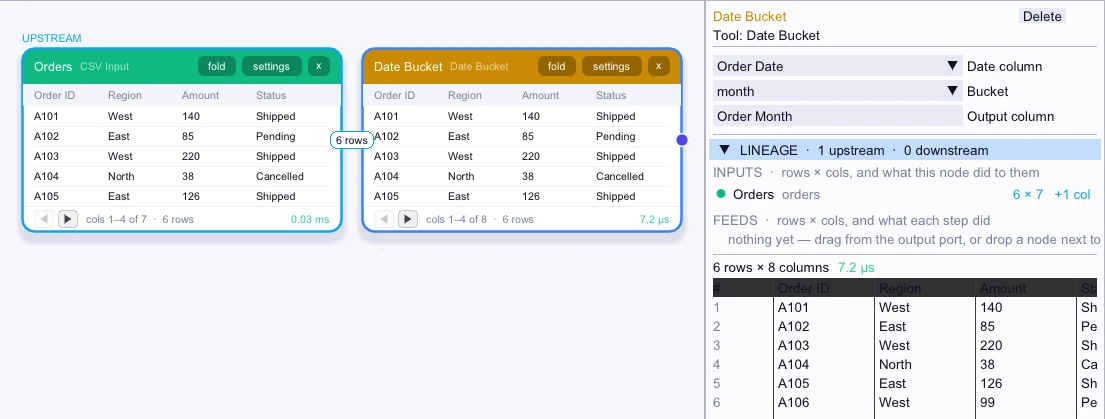
Watch exampleGroup dates by week, month, quarter, or year.
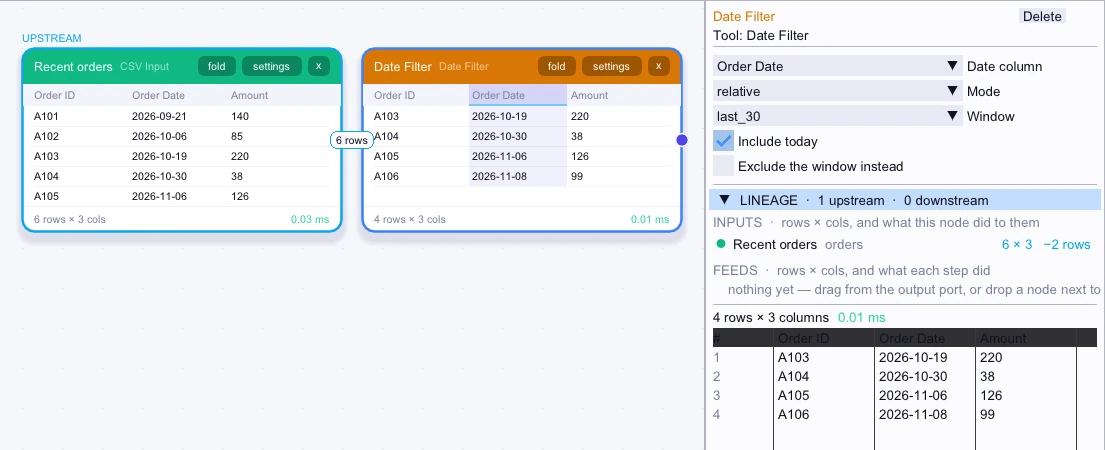
Canvas nodeSee workflowsKeep or exclude rows by relative dates, fixed ranges, or a date boundary.
Canvas nodeSee workflowsUndo or redo board edits.
Watch exampleGet suggestions for missing branches or steps while drawing.
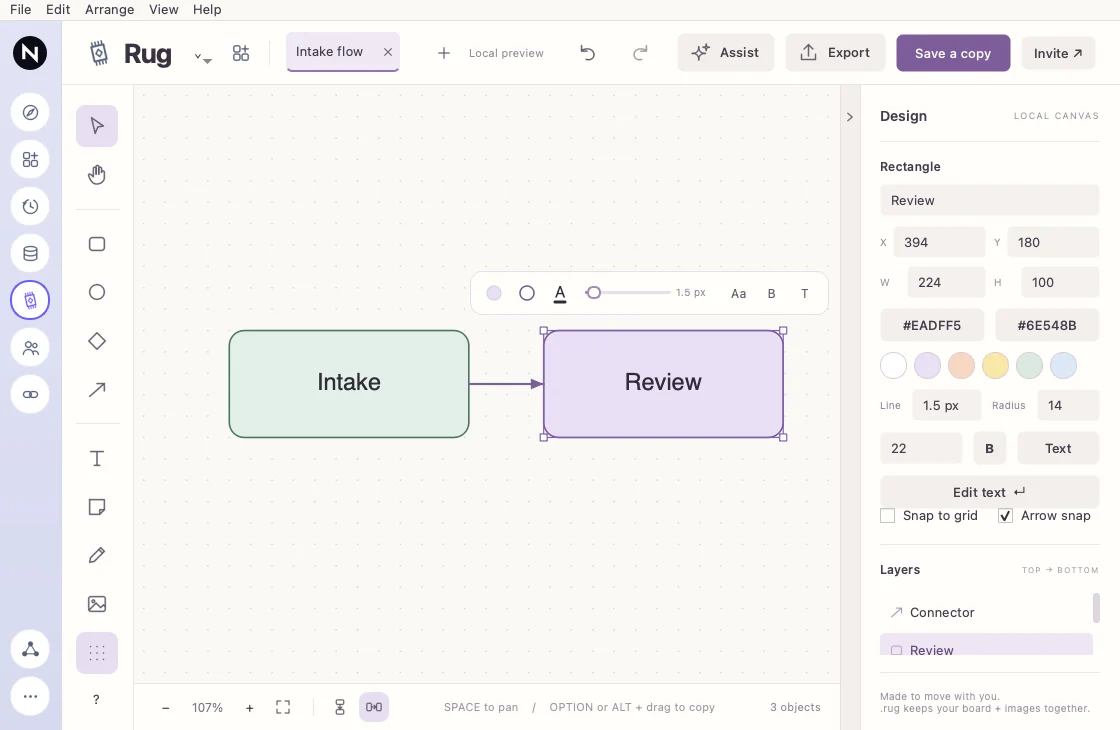
Watch exampleBuild diagrams with rectangles, ellipses, and diamonds.
Watch exampleStart a private conversation with someone from a studio.
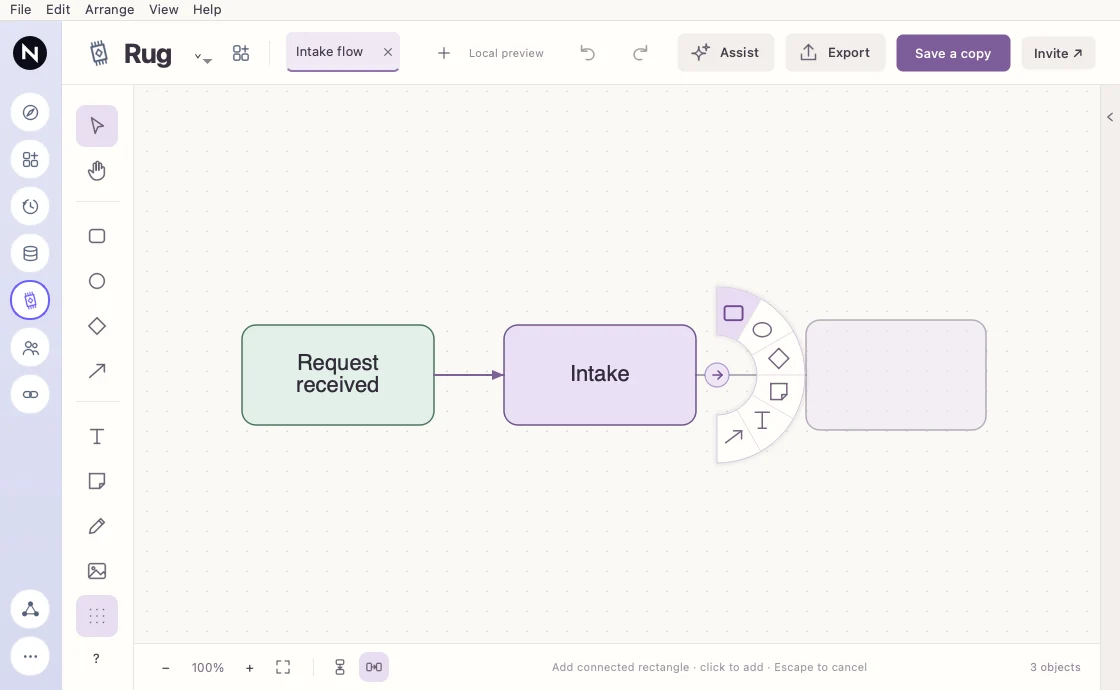
Watch exampleBranch off a shape into a connected new item.
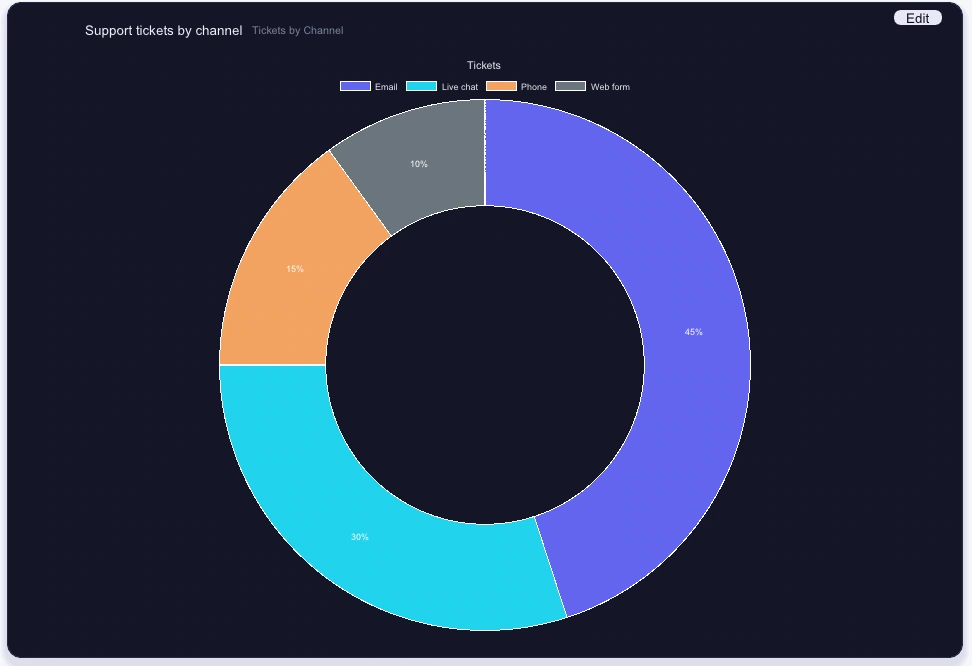
Watch exampleShow part-to-whole proportions in a ring.
Watch exampleDrop files into a studio and place them at the drop point.
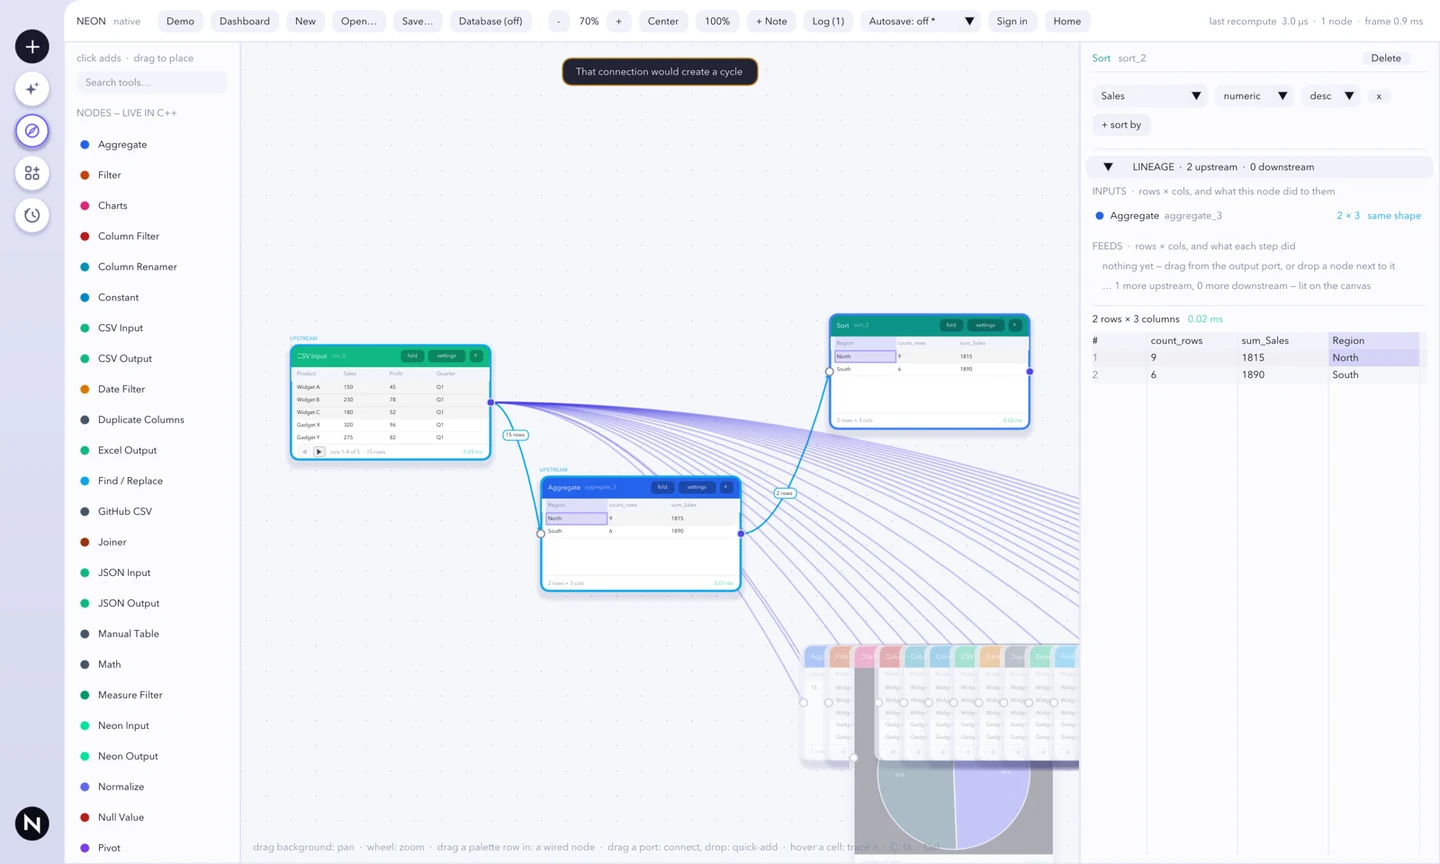
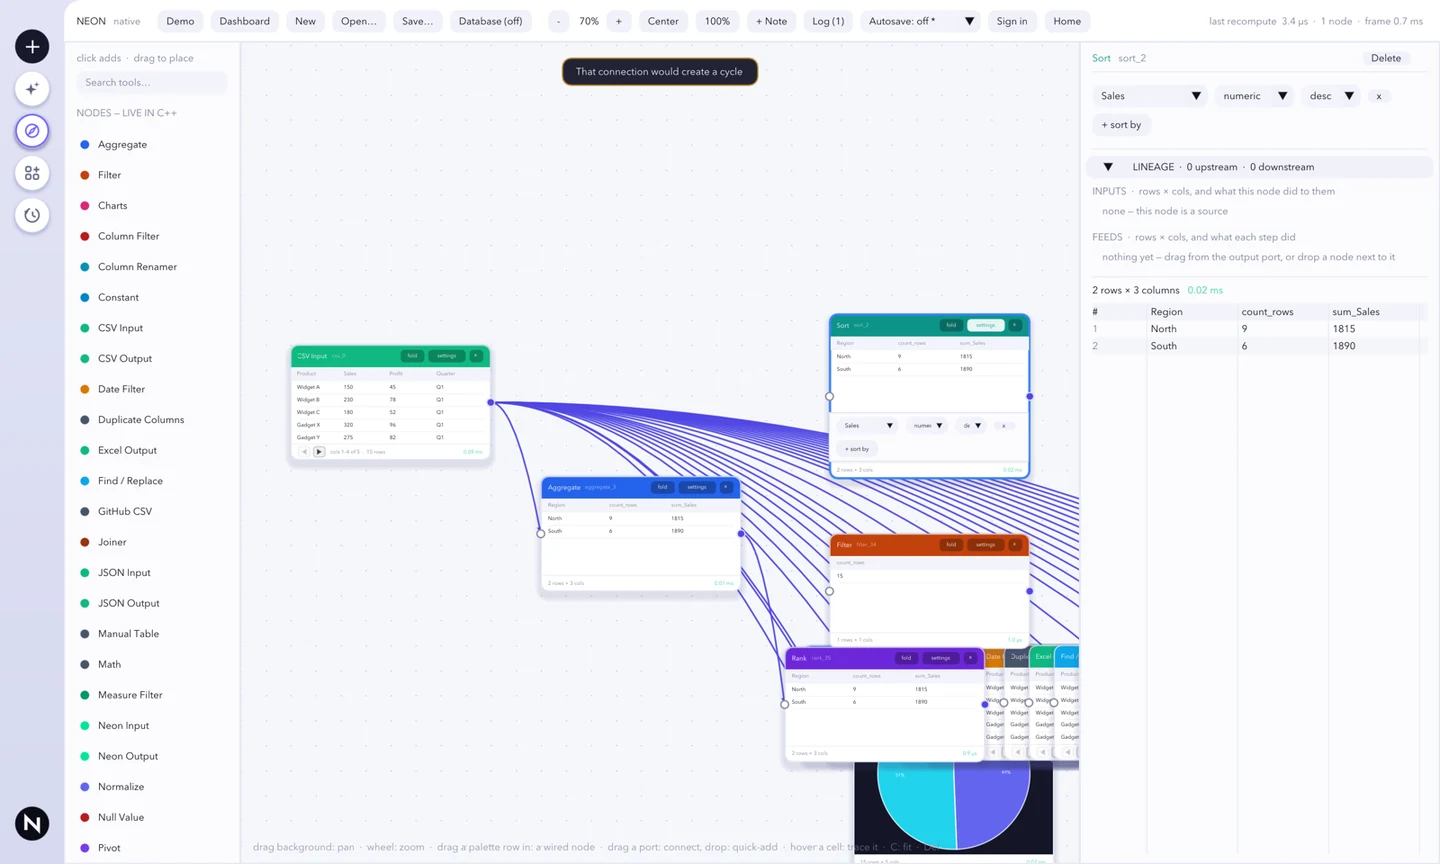
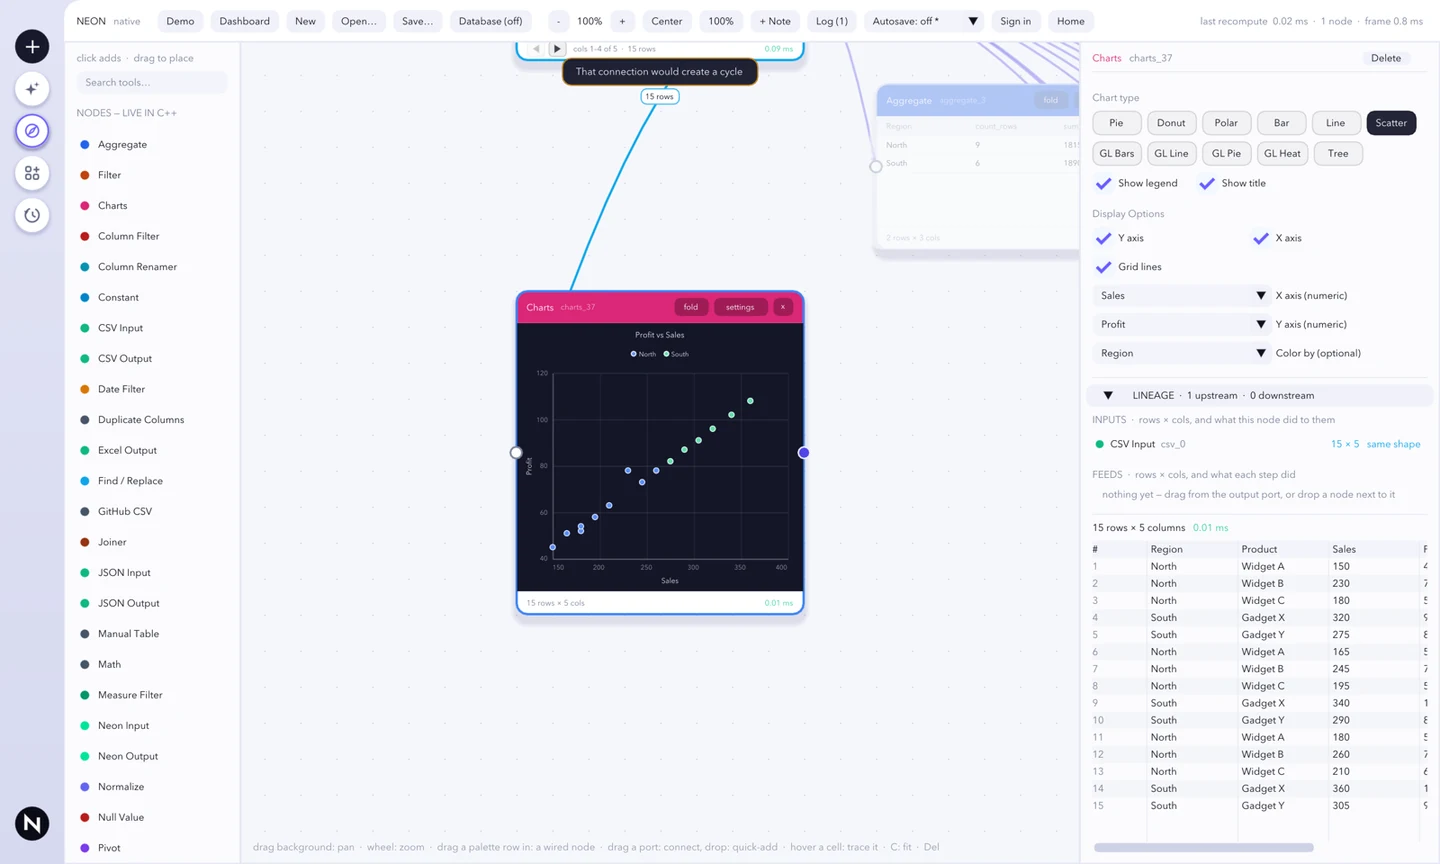
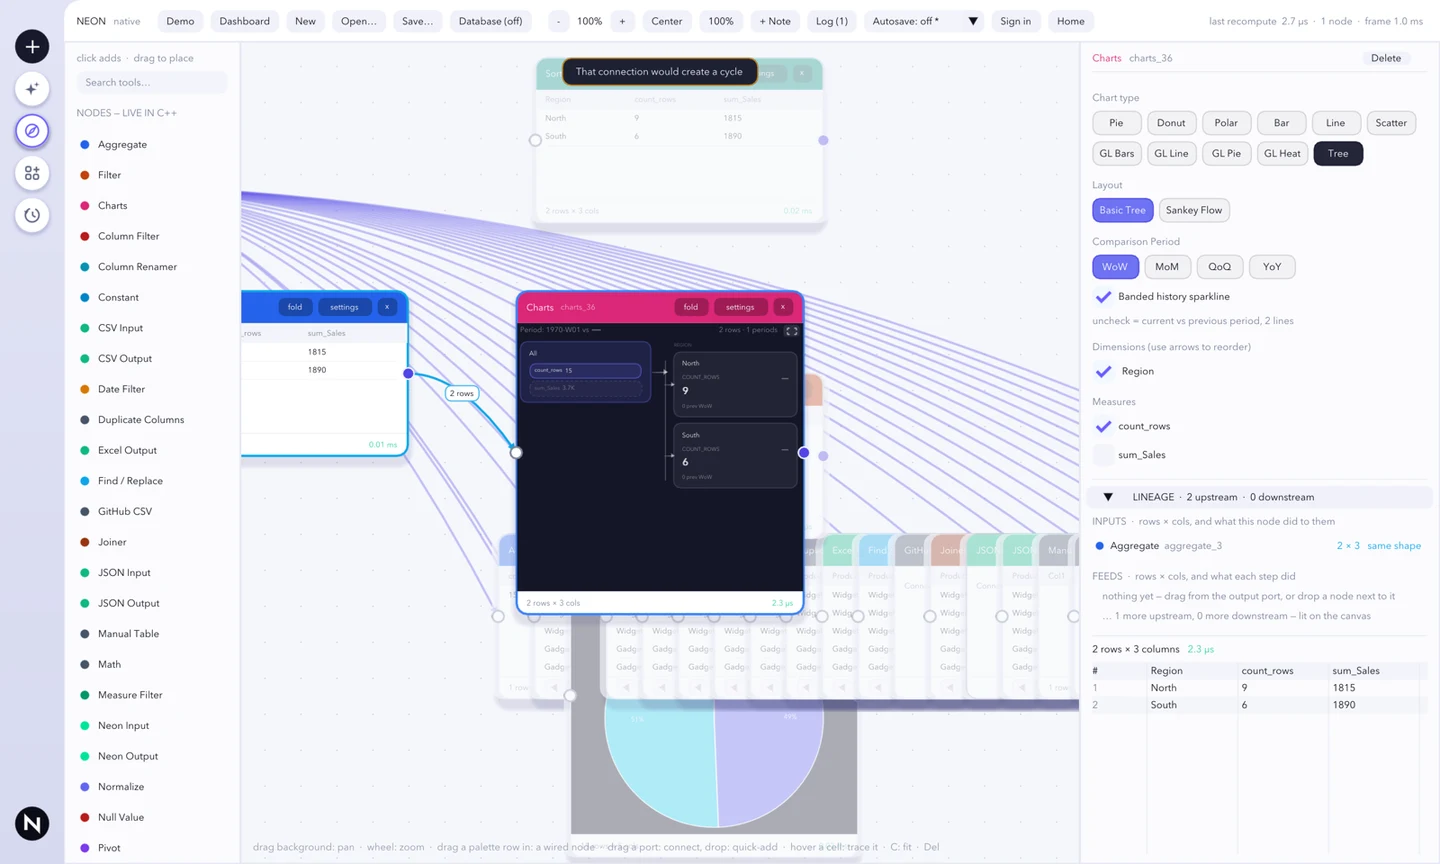
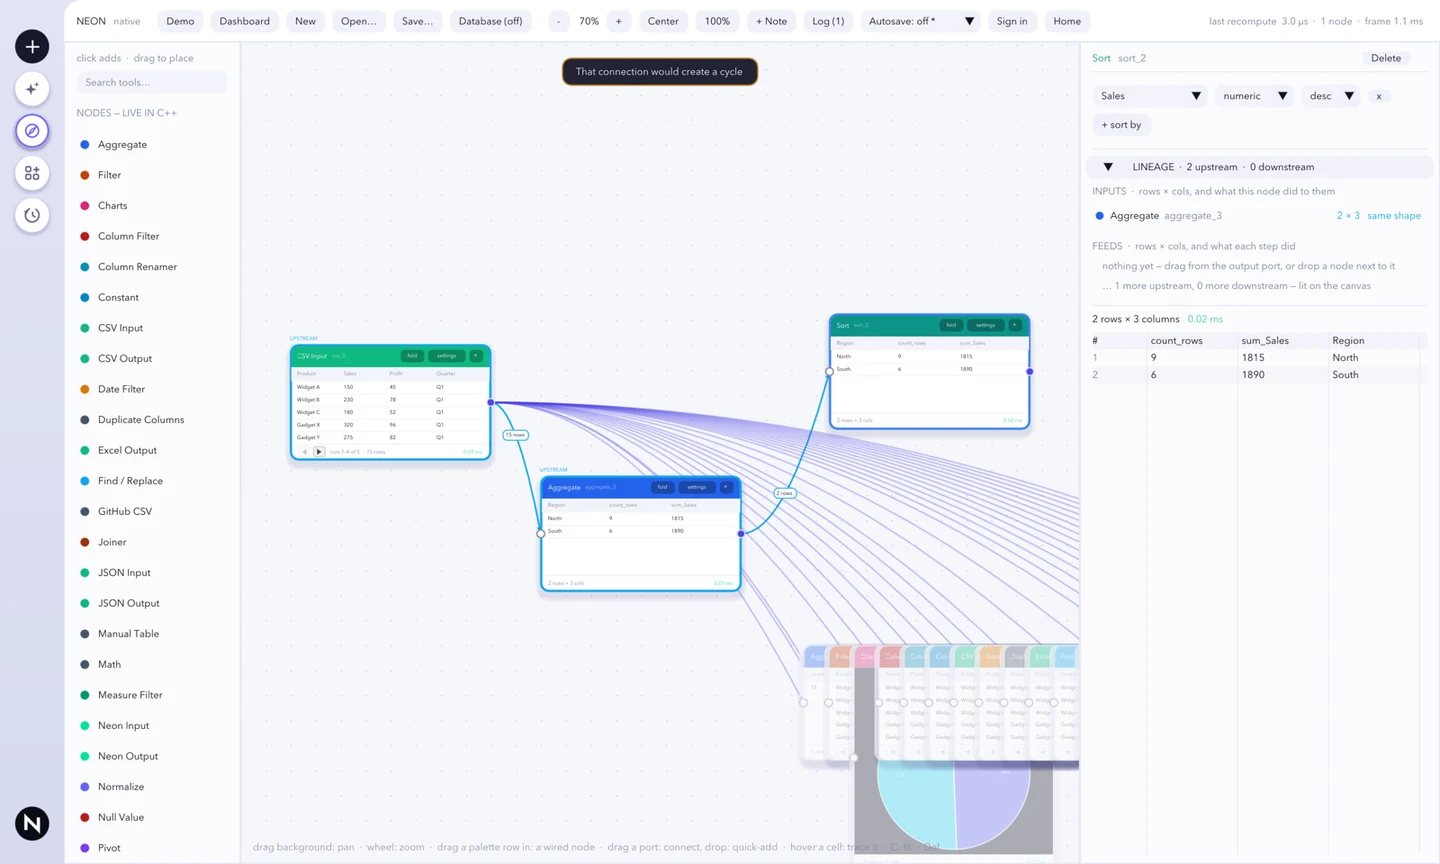
Watch exampleSnap steps together and catch circular connections.
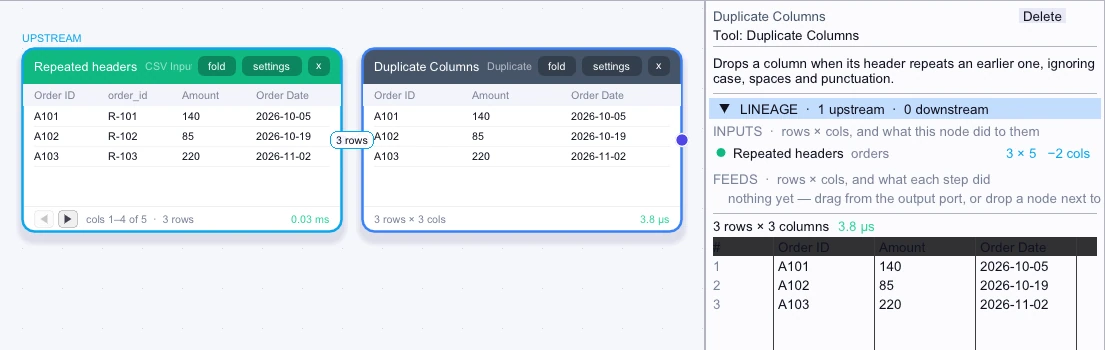
Watch exampleRemove columns whose normalized headers repeat an earlier header.
Canvas nodeSee workflows9 features
Open the workflow that powers a dashboard.
Watch exampleTake compatible studio drawing objects and images back into an editable Rug file from desktop.
Watch exampleBring a Rug board into a studio with editable drawing objects and embedded images.
Watch exampleUse a one-time email code to sign in to an existing verified account.
Watch exampleCopy an iframe or an integration snippet, or use a link, SVG image, or JSON.
Watch exampleSee energy comparisons where they were recorded.
Watch exampleCompare benchmarked data libraries and language implementations.
Watch exampleBrowse the engine and local-model measurement scoreboard.
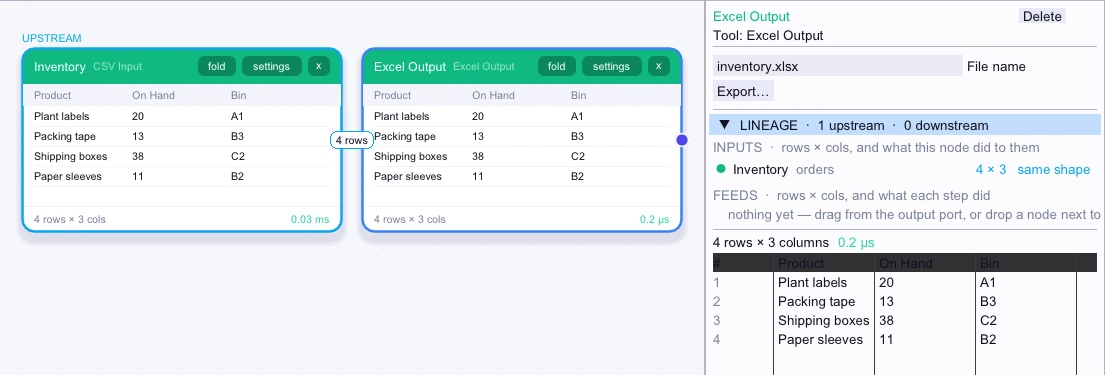
AppWatch exampleExport a pipeline table as an Excel workbook.
Canvas nodeSee workflows4 features
Keep or remove rows when a cell matches a pattern.
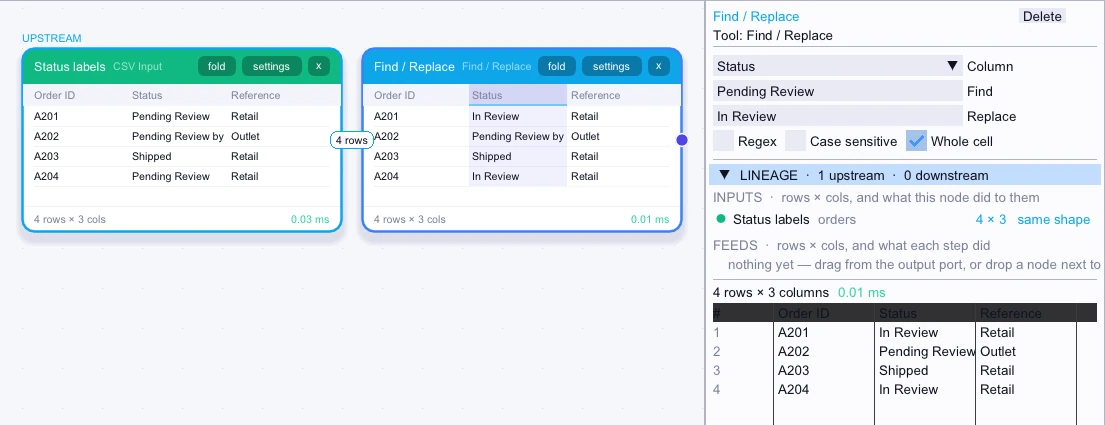
Canvas nodeSee workflowsReplace matching text or patterns in a column.
Canvas nodeSee workflowsBring supported files in from a dropped folder.
Watch exampleSketch directly on a diagram.
Watch example3 features
Explore analytics across the Gemini transcript collection.
Watch examplePreview a copied group before dropping it with its internal connections preserved.
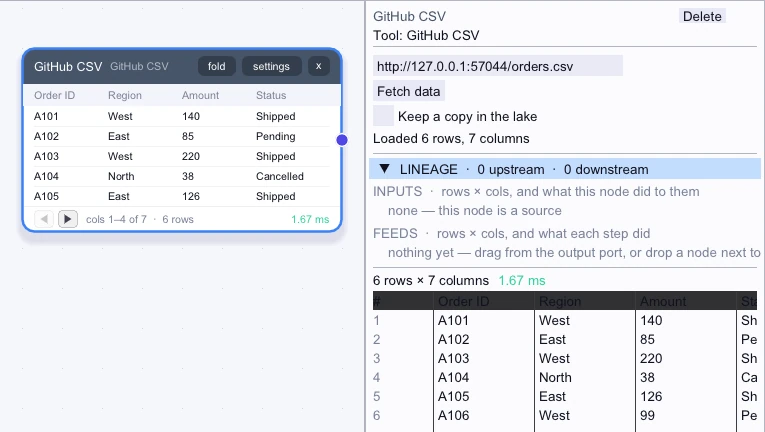
Watch exampleLoad CSV data from a GitHub URL.
Canvas nodeSee workflows1 feature
Show value intensity across a grid.
Watch example3 features
Choose a lightweight WebP preview or the saved high-resolution image.
Watch exampleChange a step directly on its card.
Watch exampleChange chart settings and remove or restore chart cards.
Watch example4 features
Compare the native engine with its previous JavaScript implementation.
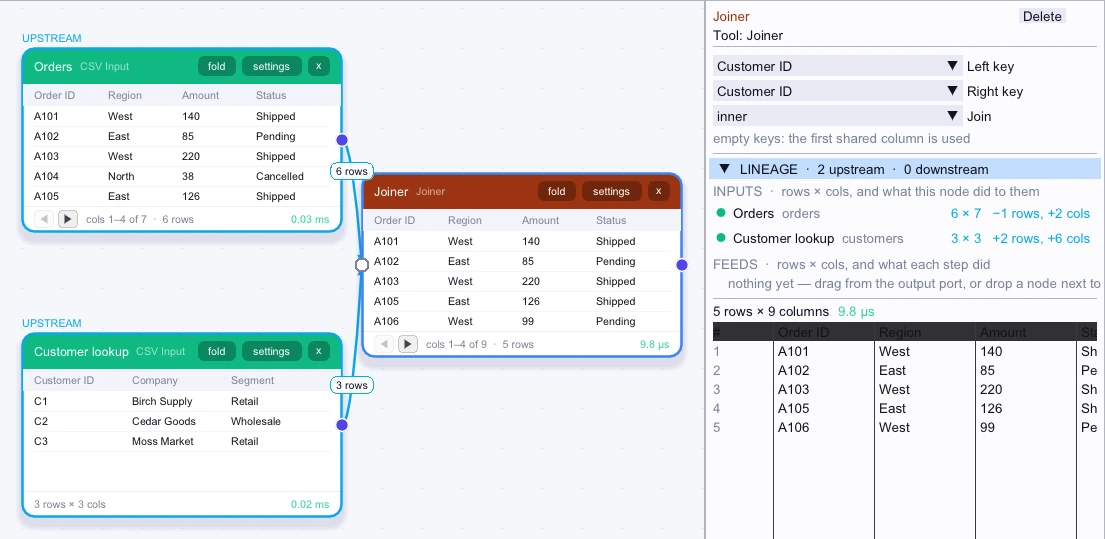
Watch exampleCombine two tables using matching keys in an inner or left join.
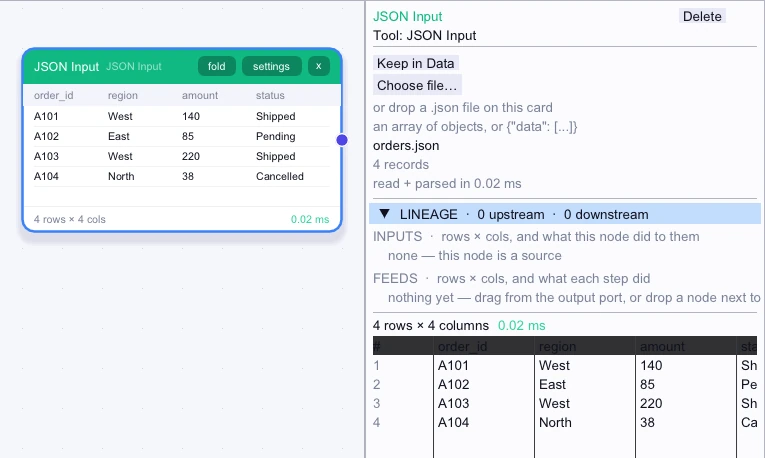
Canvas nodeSee workflowsLoad JSON data into a table.
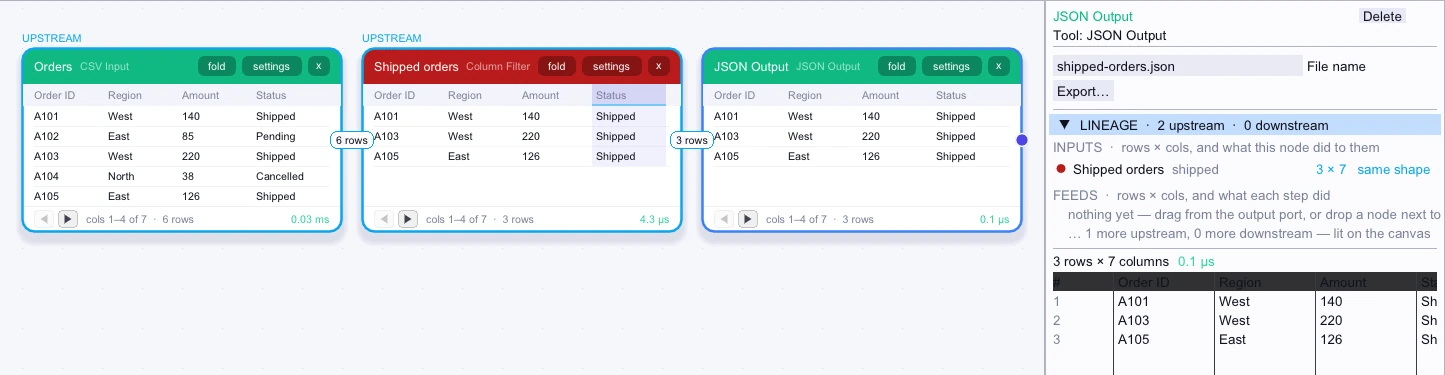
Canvas nodeSee workflowsExport connected data as a JSON file.
Canvas nodeSee workflows1 feature
Highlight a single computed measure.
Watch example12 features
Choose and keep an app-wide appearance.
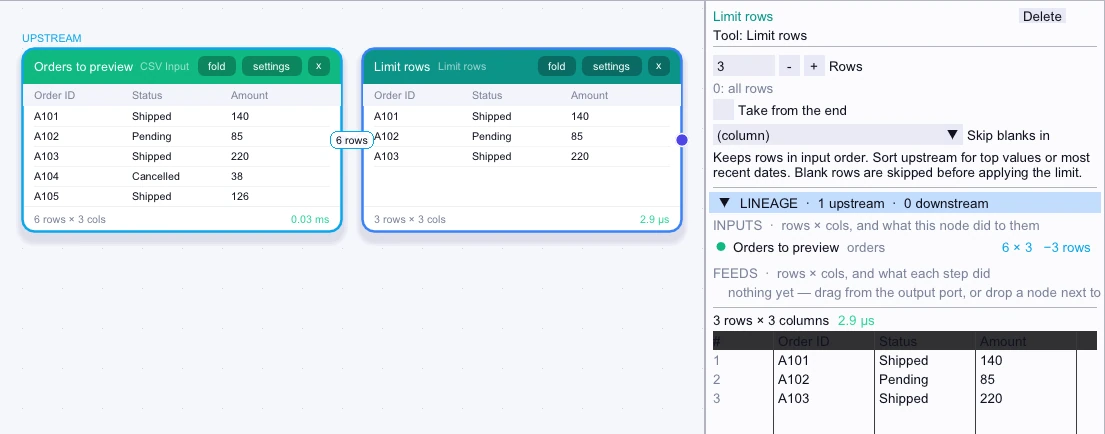
Watch exampleKeep the first or last rows, with optional blank-row skipping.
Canvas nodeSee workflowsShow change across an ordered series.
Watch exampleSee who is connected and where they are working on the board.
Watch exampleKeep an open embed in sync when its saved result is updated.
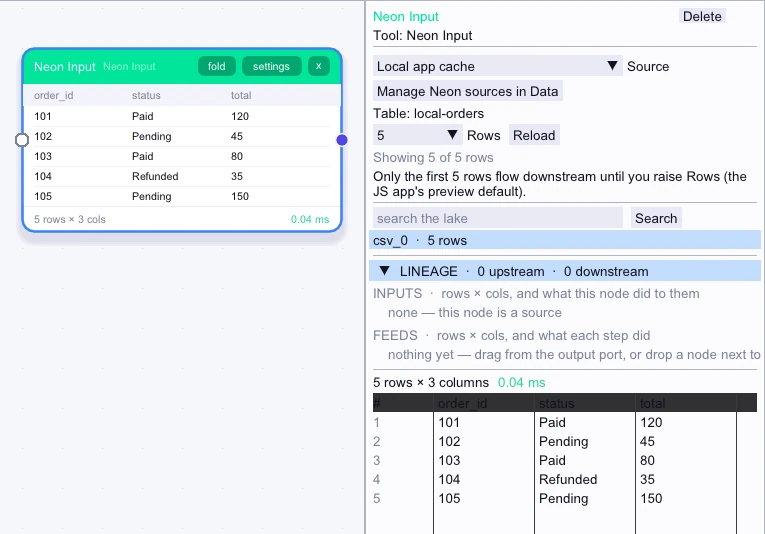
Watch exampleSee sample output rows and page through wide tables on each node.
Watch exampleRender a dashboard from the charts in the current pipeline.
Watch exampleConnect an existing local model connector and mention the agent in studio chat for a reply.
Watch exampleDrop or browse for CSV, TSV, TXT, and JSON files while preserving originals.
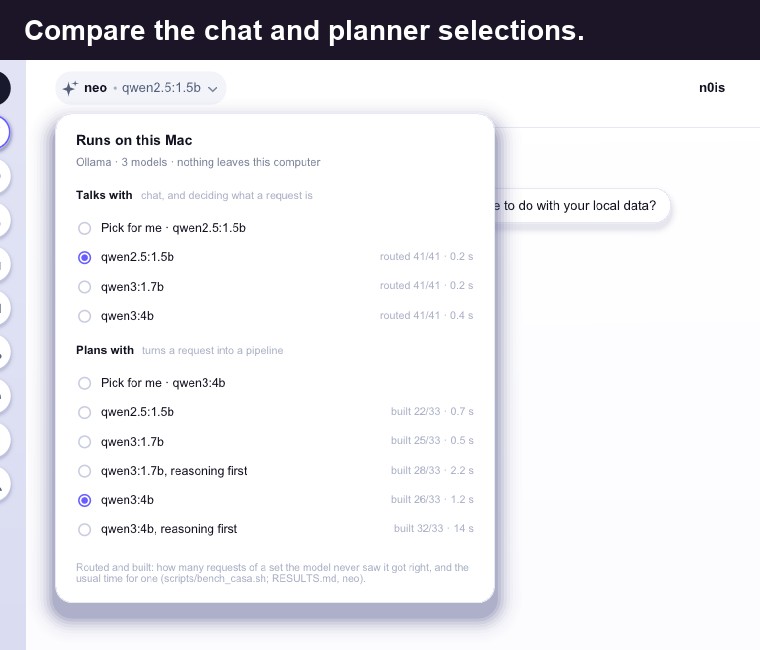
Watch exampleChoose separate models for conversation and planning, with measured model results where available.
Watch exampleBring a remote table onto your machine for offline work.
Watch exampleDownload and set up Neo, Voice, and Rug from one panel for later offline use.
Watch example9 features
Rebuild a local table snapshot on demand.
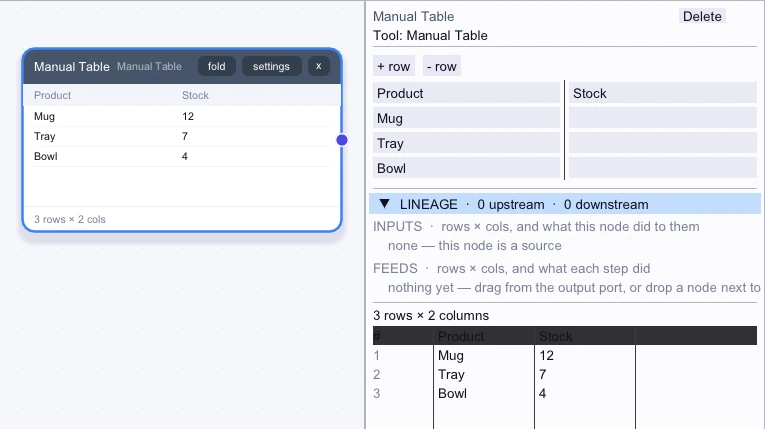
Watch exampleEnter data directly in an editable grid.
Canvas nodeSee workflowsSpeak into an editable draft and send it when ready.
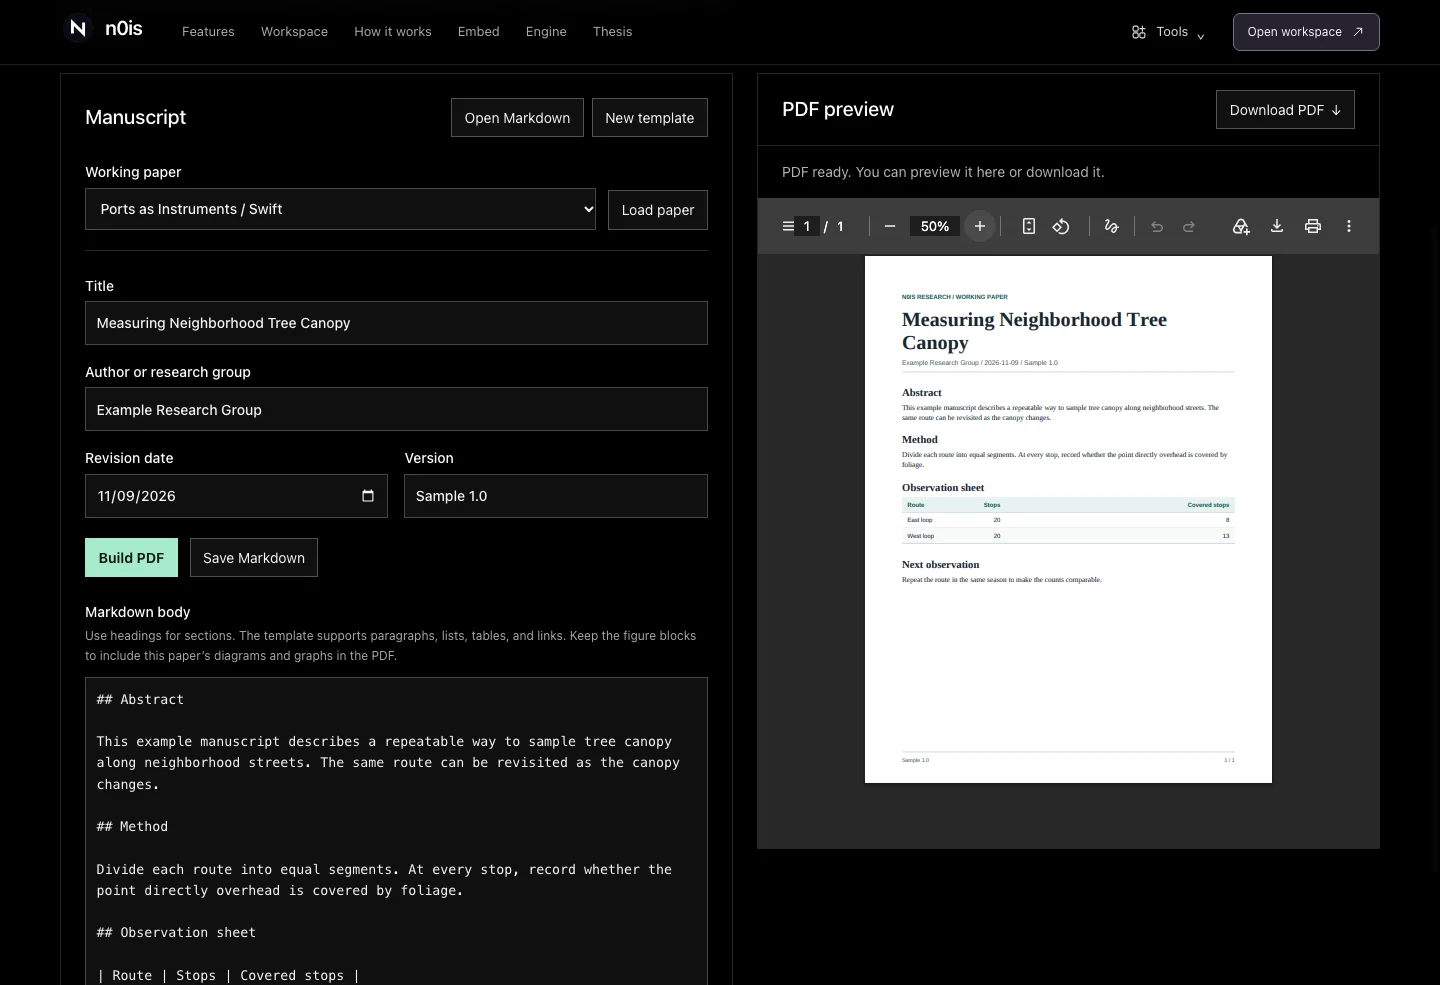
Watch exampleOpen an existing manuscript and save an editable revision.
Watch exampleEdit the manuscript and publication metadata together.
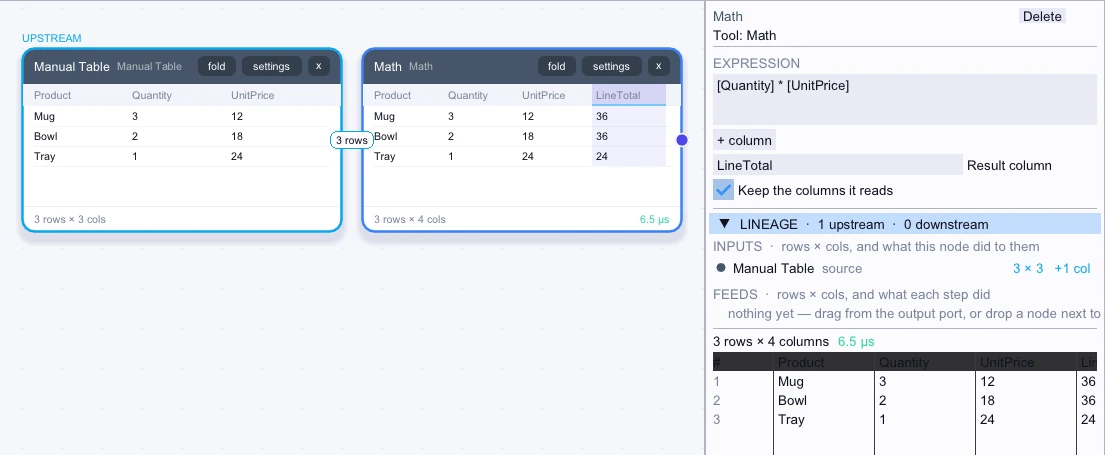
Watch exampleCalculate a column from an expression using input values.
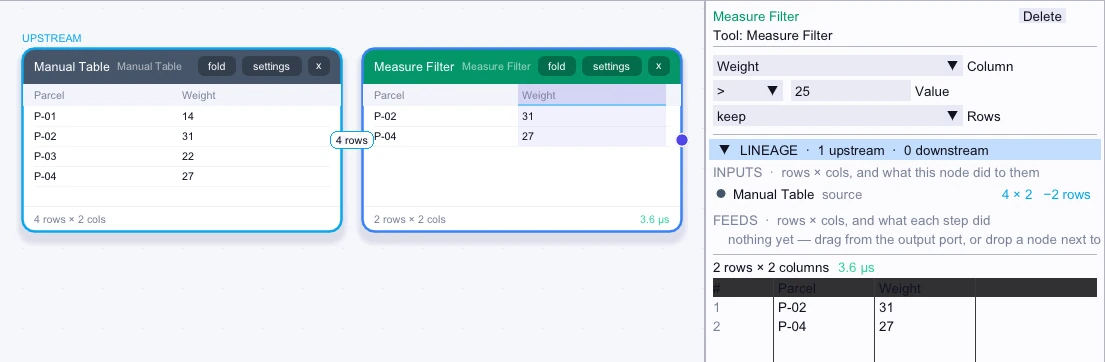
Canvas nodeSee workflowsKeep or remove rows by comparing a numeric column with a threshold.
Canvas nodeSee workflowsRead locally produced insights with quoted source evidence.
Watch exampleTurn discussion and transcripts into visual documentation.
Watch example9 features
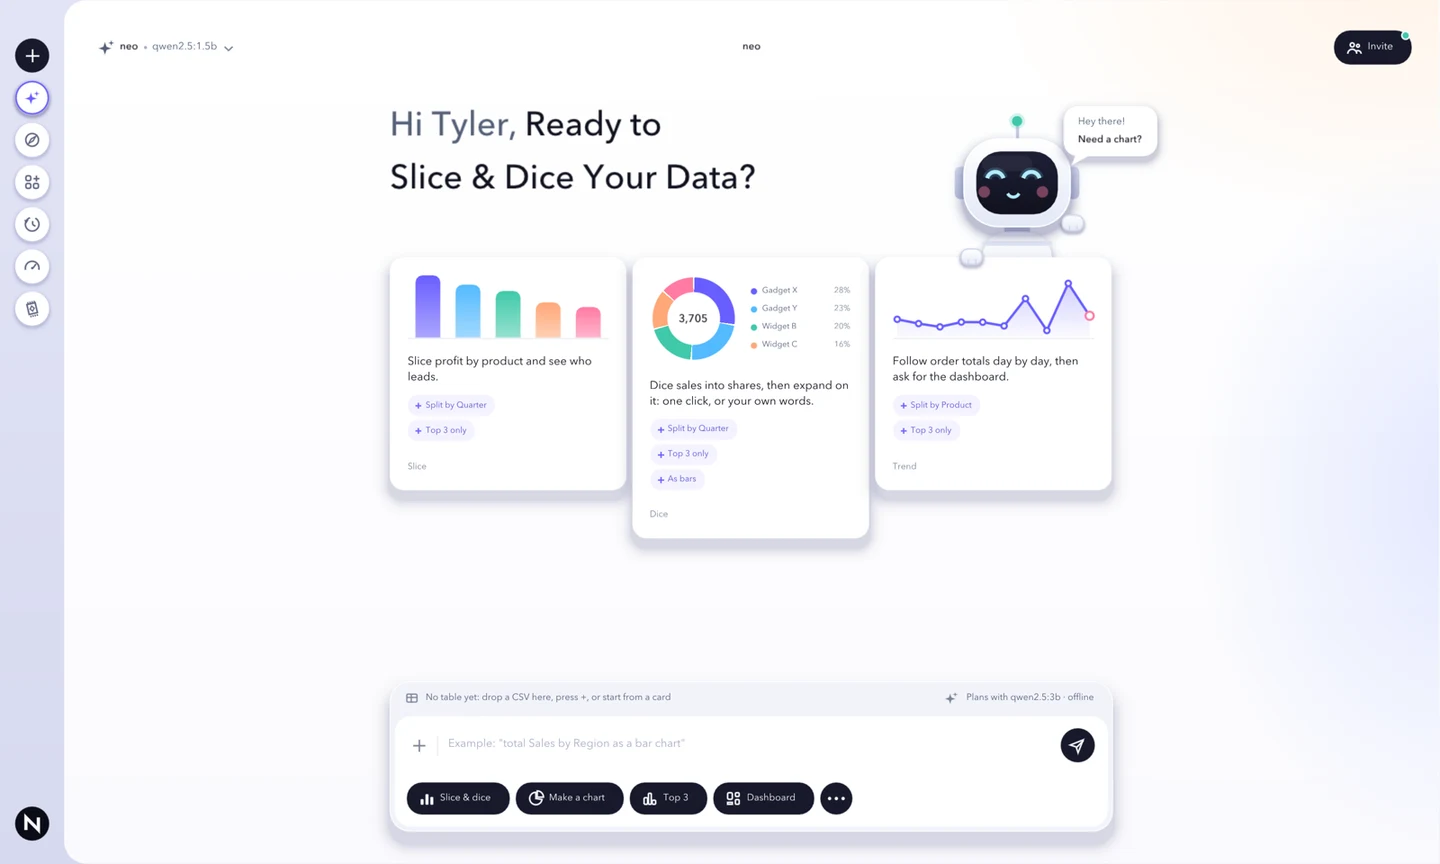
Use the local workspace for data, workflows, dashboards, diagrams, and assistants.
AppWatch exampleAsk a local assistant questions about your data and the results you build.
AppWatch exampleRead a stored table into a workflow.
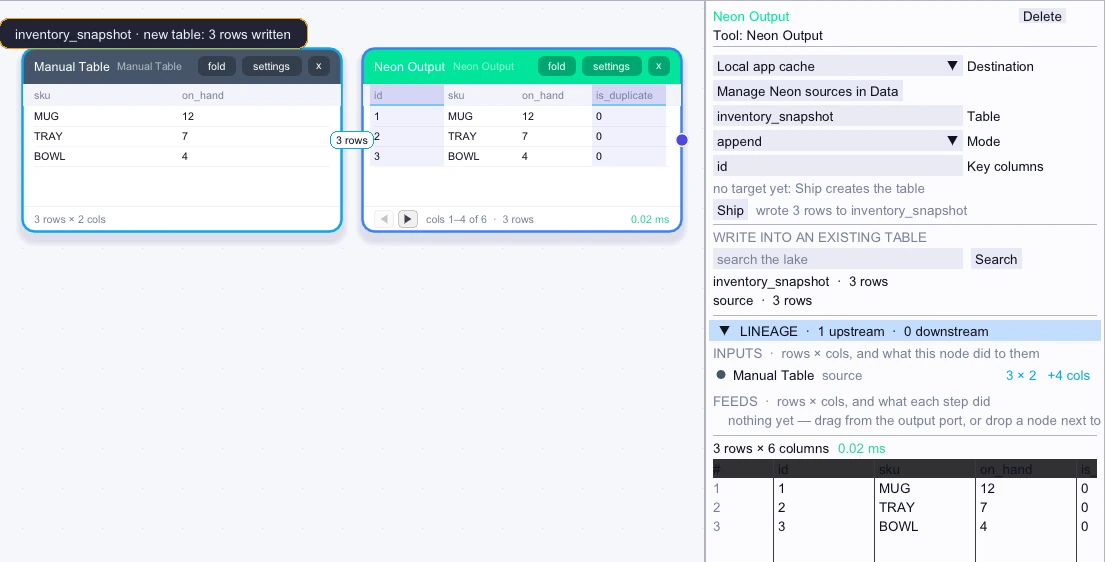
Canvas nodeSee workflowsWrite workflow results to the local store or to an existing table on a verified development branch.
Canvas nodeSee workflowsManage connected Neon databases in Data.
Watch exampleStart a fresh chat and retain the work already on Canvas.
Watch exampleSee how long workflow steps take to produce their output.
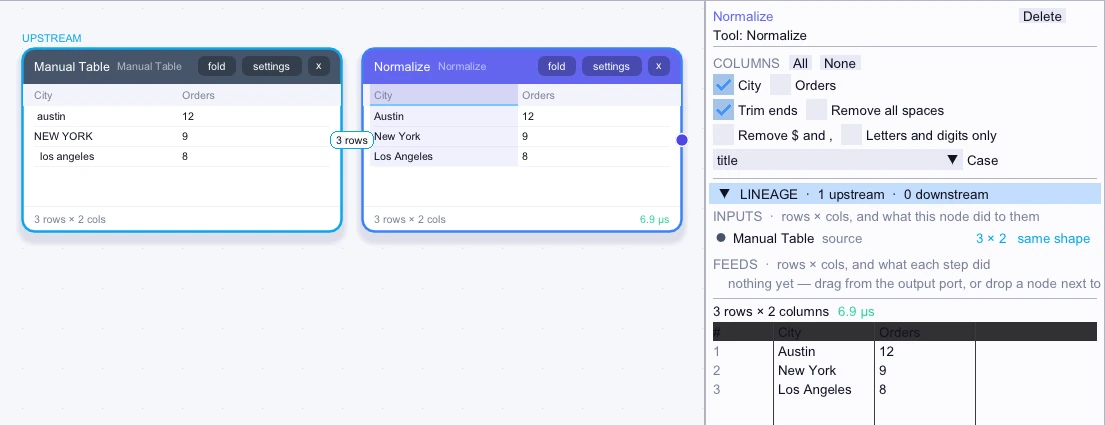
Watch exampleClean up spaces, capitalization, and formatting in selected columns.
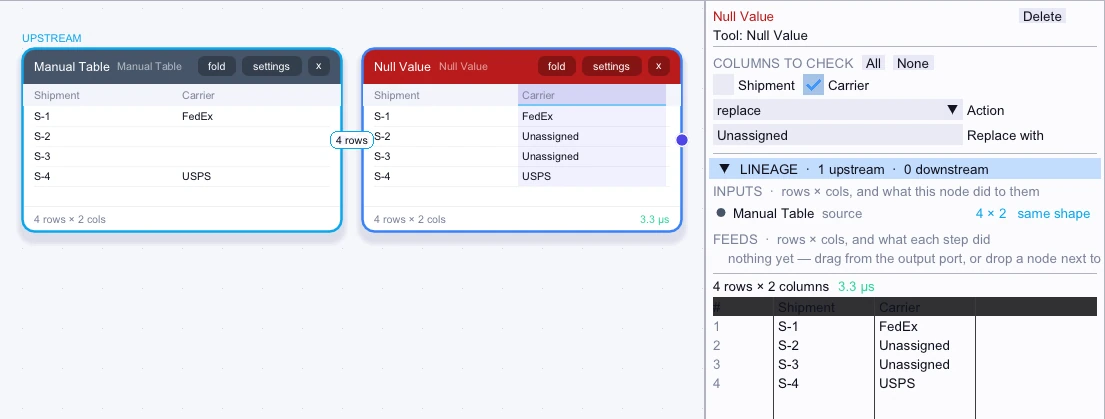
Canvas nodeSee workflowsFill missing values or remove rows that are missing a selected value.
Canvas nodeSee workflows9 features
Set fills, strokes, opacity, corners, and text appearance.
Watch exampleReview unsent work from a local recovery copy.
Watch exampleRun workflows on your computer when their inputs are available locally.
Watch exampleJump from a result to the workflow steps that produced it.
Watch exampleJump from shared browser work into a desktop workflow or diagram editor.
Watch exampleFind comparisons and analytical insights.
Watch exampleExplore analytics in a separate Otter transcript collection.
Watch exampleInspect the full scrollable result of a step.
Watch exampleFind local boards through visual previews.
Watch example12 features
Preview the formatted paper and download its PDF.
Watch exampleShow each category's share of a whole.
Watch exampleAdd a computed chart or KPI from a conversation.
Watch exampleGather several connectors into a parallel bundle.
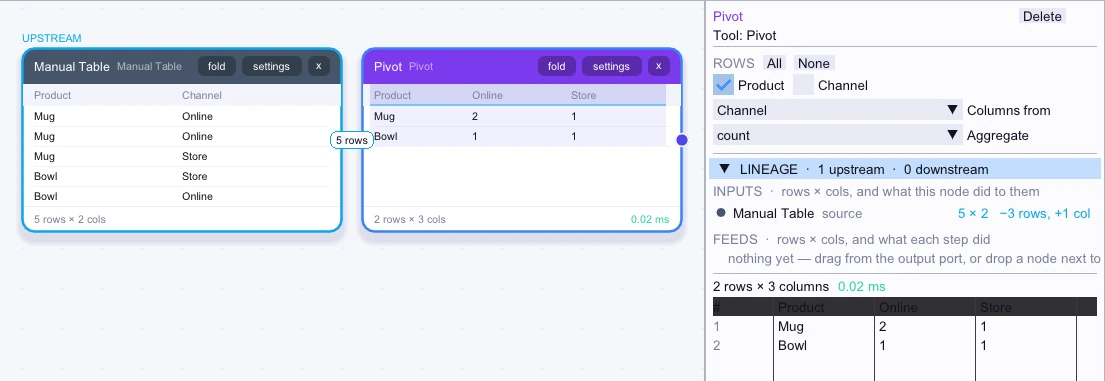
Watch exampleTurn distinct values into columns and summarize each group.
Canvas nodeSee workflowsCompare values with equal-angle sectors of varying radius.
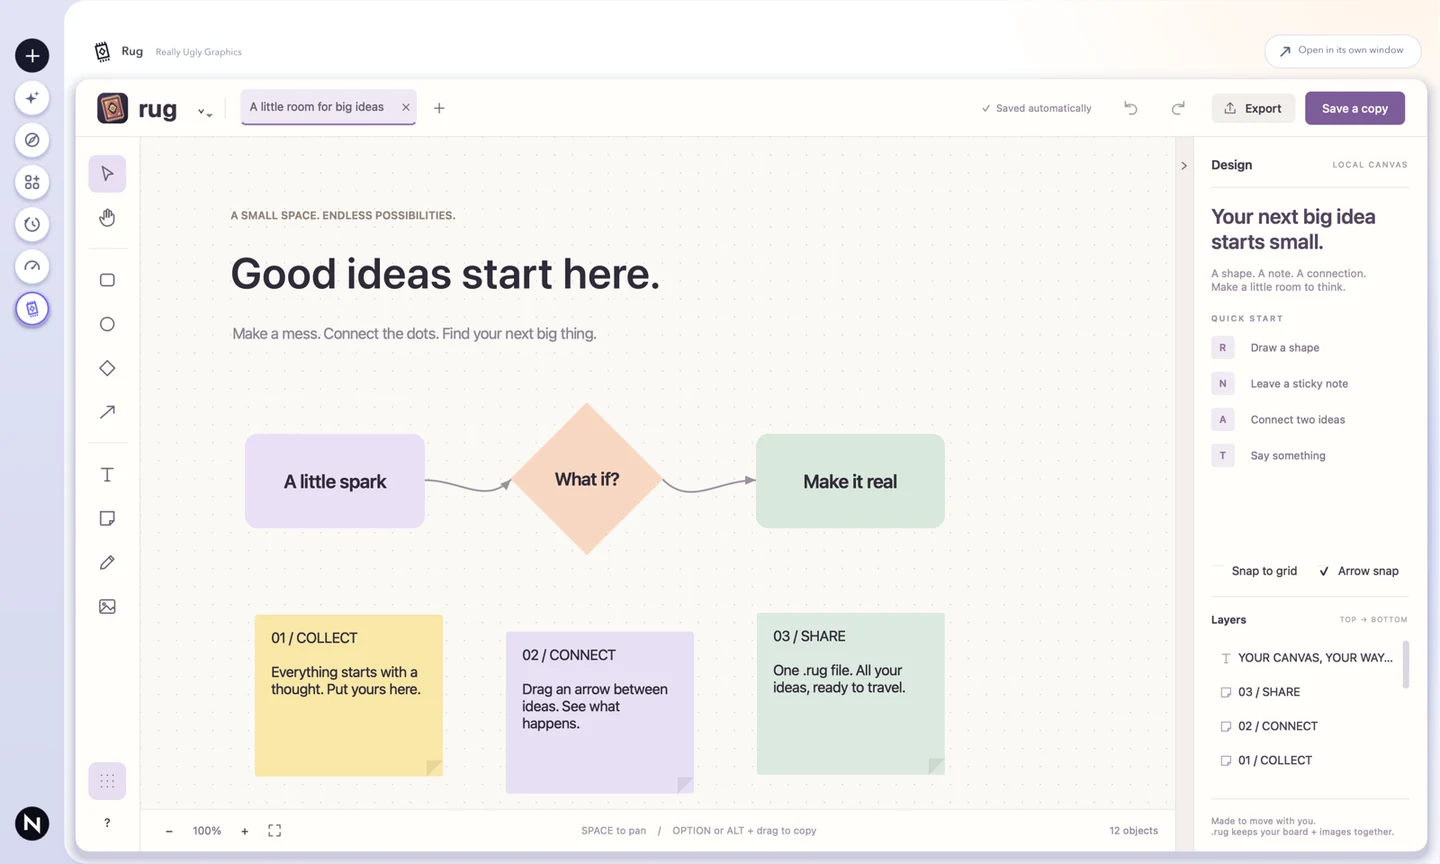
Watch exampleSave an editable board with its embedded images as a portable file.
Watch exampleOpen or save a separate JSON copy of a pipeline.
Watch exampleConnect your own Neon database for browsing and imports using your own credentials.
Watch exampleStart a studio on your computer and work without signing in.
Watch exampleTurn a plain-language request into connected, editable Canvas nodes.
Watch exampleReview and publish a saved result, then update it or revoke its public link from the Work Library.
Watch example18 features
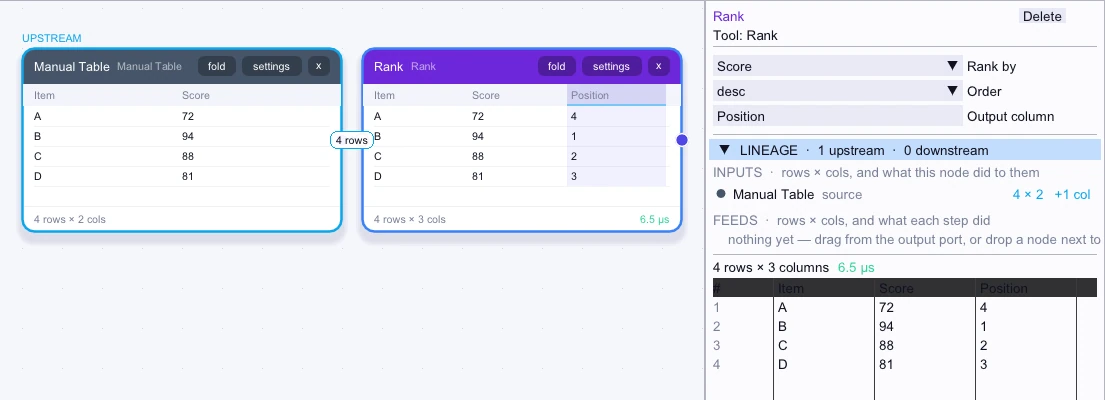
Add a ranking column in ascending or descending order.
Canvas nodeSee workflowsSave a board as a scaled PNG or JPEG.
Watch exampleGive supported local models time to reason through a plan.
Watch exampleCheck refresh counts, durations, and errors.
Watch exampleBrowse remote tables and compare estimates with local snapshot counts.
Watch exampleStart with a paper template or load an example manuscript.
Watch exampleTurn a Markdown manuscript into a research PDF in your browser.
AppWatch exampleFind or restore a board reference to a file the studio already has.
Watch exampleAdd a chart to a provider dashboard across a collection or for one meeting.
Watch exampleDraw local diagrams, process maps, and sketches inside n0is Desktop.
AppWatch exampleDraft and preview a diagram from text and connections already on a board.
Watch exampleDraft multiple diagram styles from pasted notes or transcripts with local models.
Watch exampleRecover saved boards and resume the tab session.
Watch exampleDrop PNG and JPEG images into a board.
Watch exampleReplay the guided product film or the step-by-step tutorial.
Watch exampleAnnotate diagrams with notes, labels, and free-standing text.
Watch examplePan, pinch to zoom, fit the board, or snap objects to the grid.
Watch examplePlace a previously shared Rug preview or SVG on a studio board.
Watch example41 features
Open a prewired pipeline on bundled sample data.
Watch exampleFollow quantities as they move between groups.
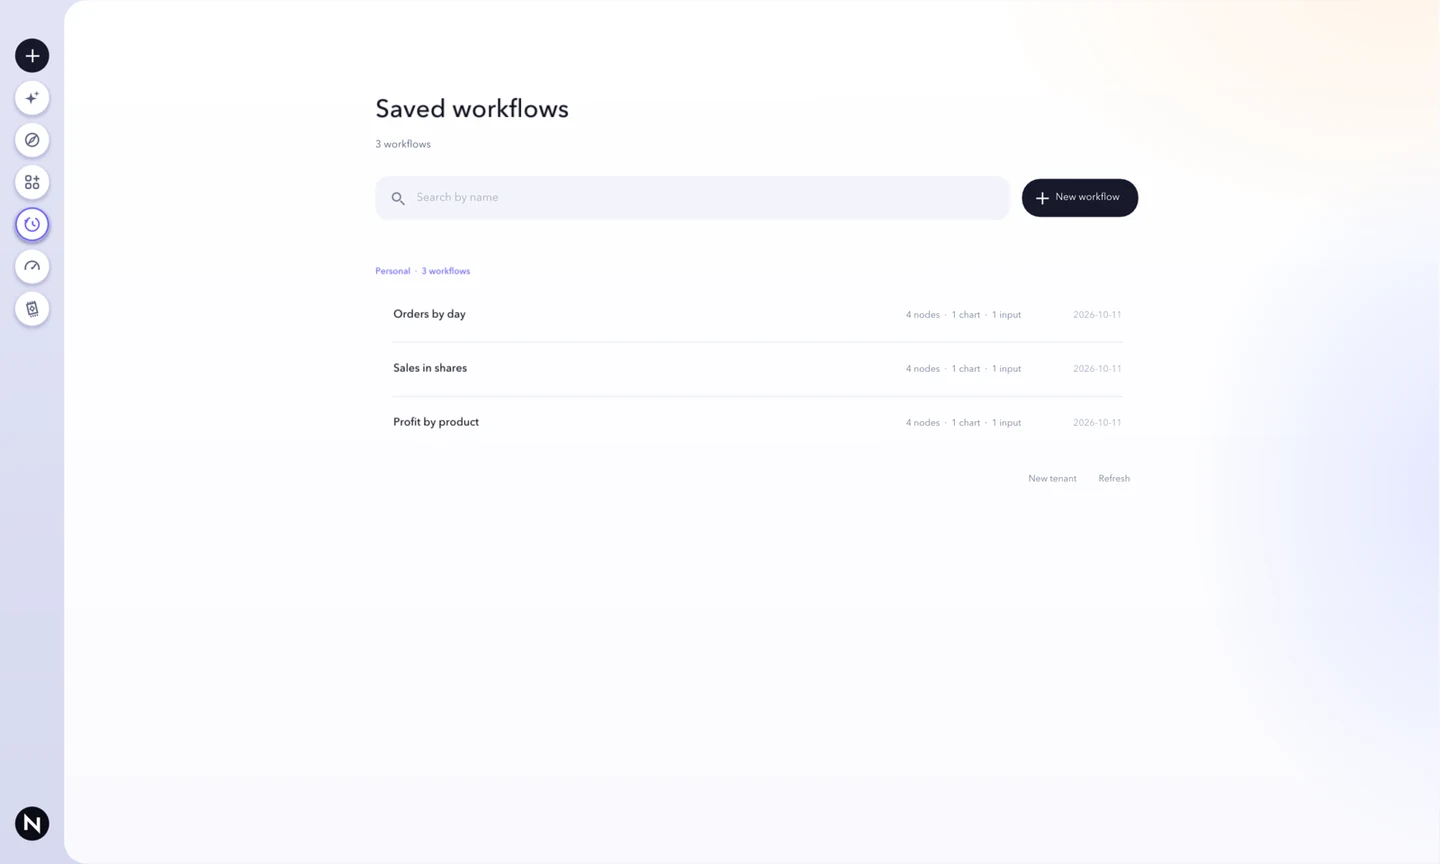
Watch exampleOpen the workflows library and return to past work.
AppWatch exampleCompare two numeric columns and color points by another field.
Watch exampleCopy new changes for eligible tables while the app runs.
Watch exampleFind a workflow node by name.
Watch exampleMove, resize, align, and reorder diagram objects across layers.
Watch exampleSet the exact size, position, and colors of a shape in Rug.
Watch examplePublish a local board for collaboration and choose which offline changes to sync.
Watch exampleCopy a link to a studio or shared item for people who have access.
Watch exampleAdjust saved chart axes, grid, and labels from the studio board.
Watch exampleBrowse data files and table snapshots shared in studios.
Watch exampleCopy a sample of rows from a connected table into a studio.
Watch exampleFind, filter, and download files and images from studios you can access.
Watch exampleArrange notes, diagrams, workflows, dashboards, and files on one board.
Watch examplePreview saved ET1 graphs and copy accessible workflows into another studio.
Watch exampleBring an existing ET1 file into a studio or export a shared copy.
Watch exampleOpen a chart at full size.
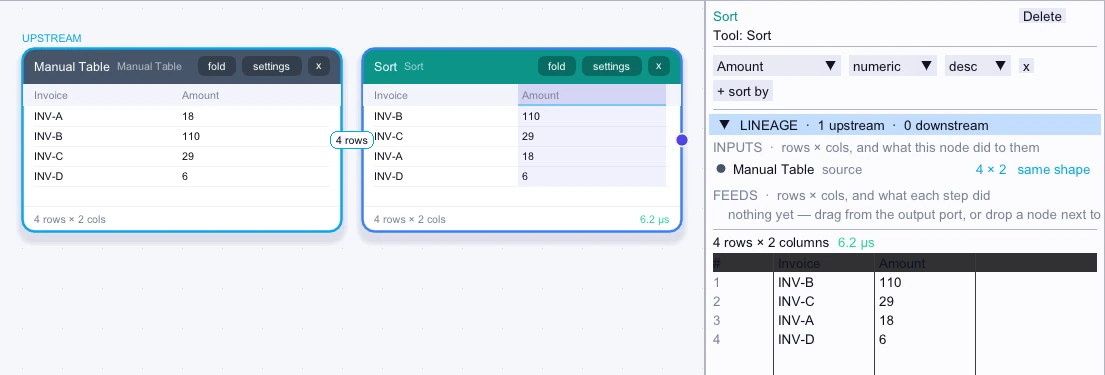
Watch exampleOrder rows by one or more text, numeric, or date columns.
Canvas nodeSee workflowsStart a workflow using a file from the Data library.
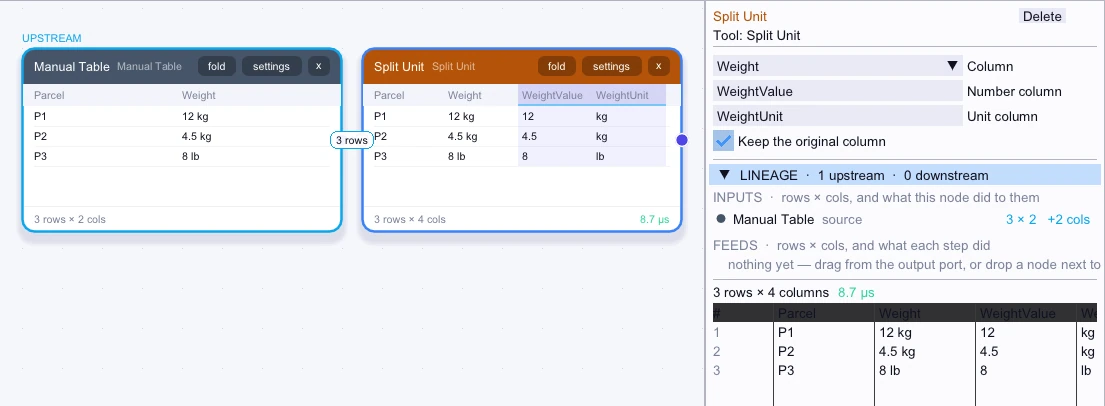
Watch exampleSeparate a measurement into its numeric value and unit.
Canvas nodeSee workflowsSee how much studio storage your account uses.
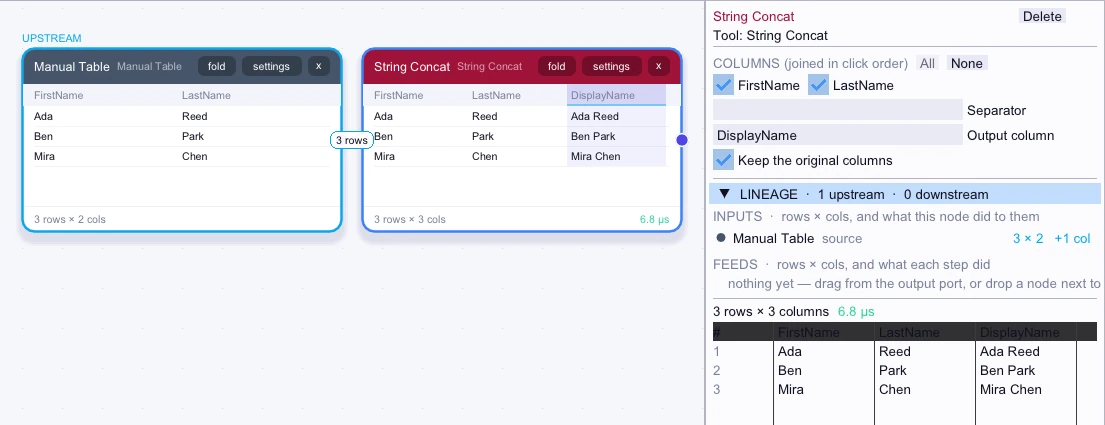
Watch exampleCombine selected text columns with a separator.
Canvas nodeSee workflowsSplit text into columns at a delimiter.
Canvas nodeSee workflowsZoom into details or fit the shared board in view.
Watch exampleDownload a copy of the board layout.
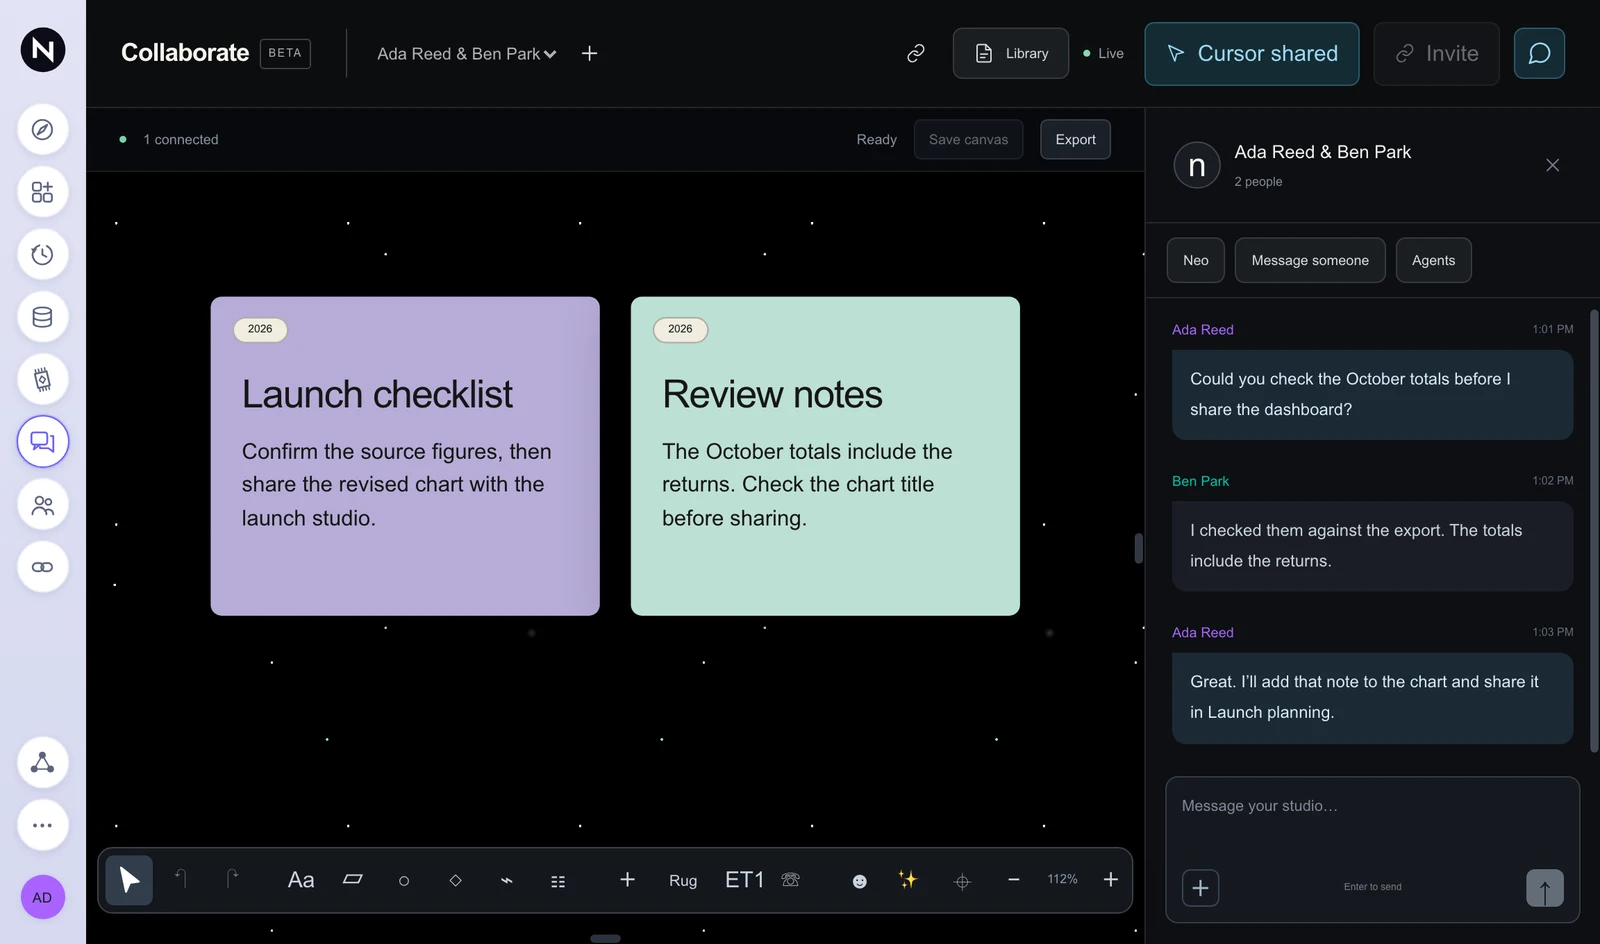
Watch exampleDiscuss work with everyone in the studio.
Watch exampleDrop quick reactions onto the shared board.
Watch exampleSketch directly on a shared board.
Watch exampleFind and switch among local or shared studios.
Watch exampleView shared images directly on the board.
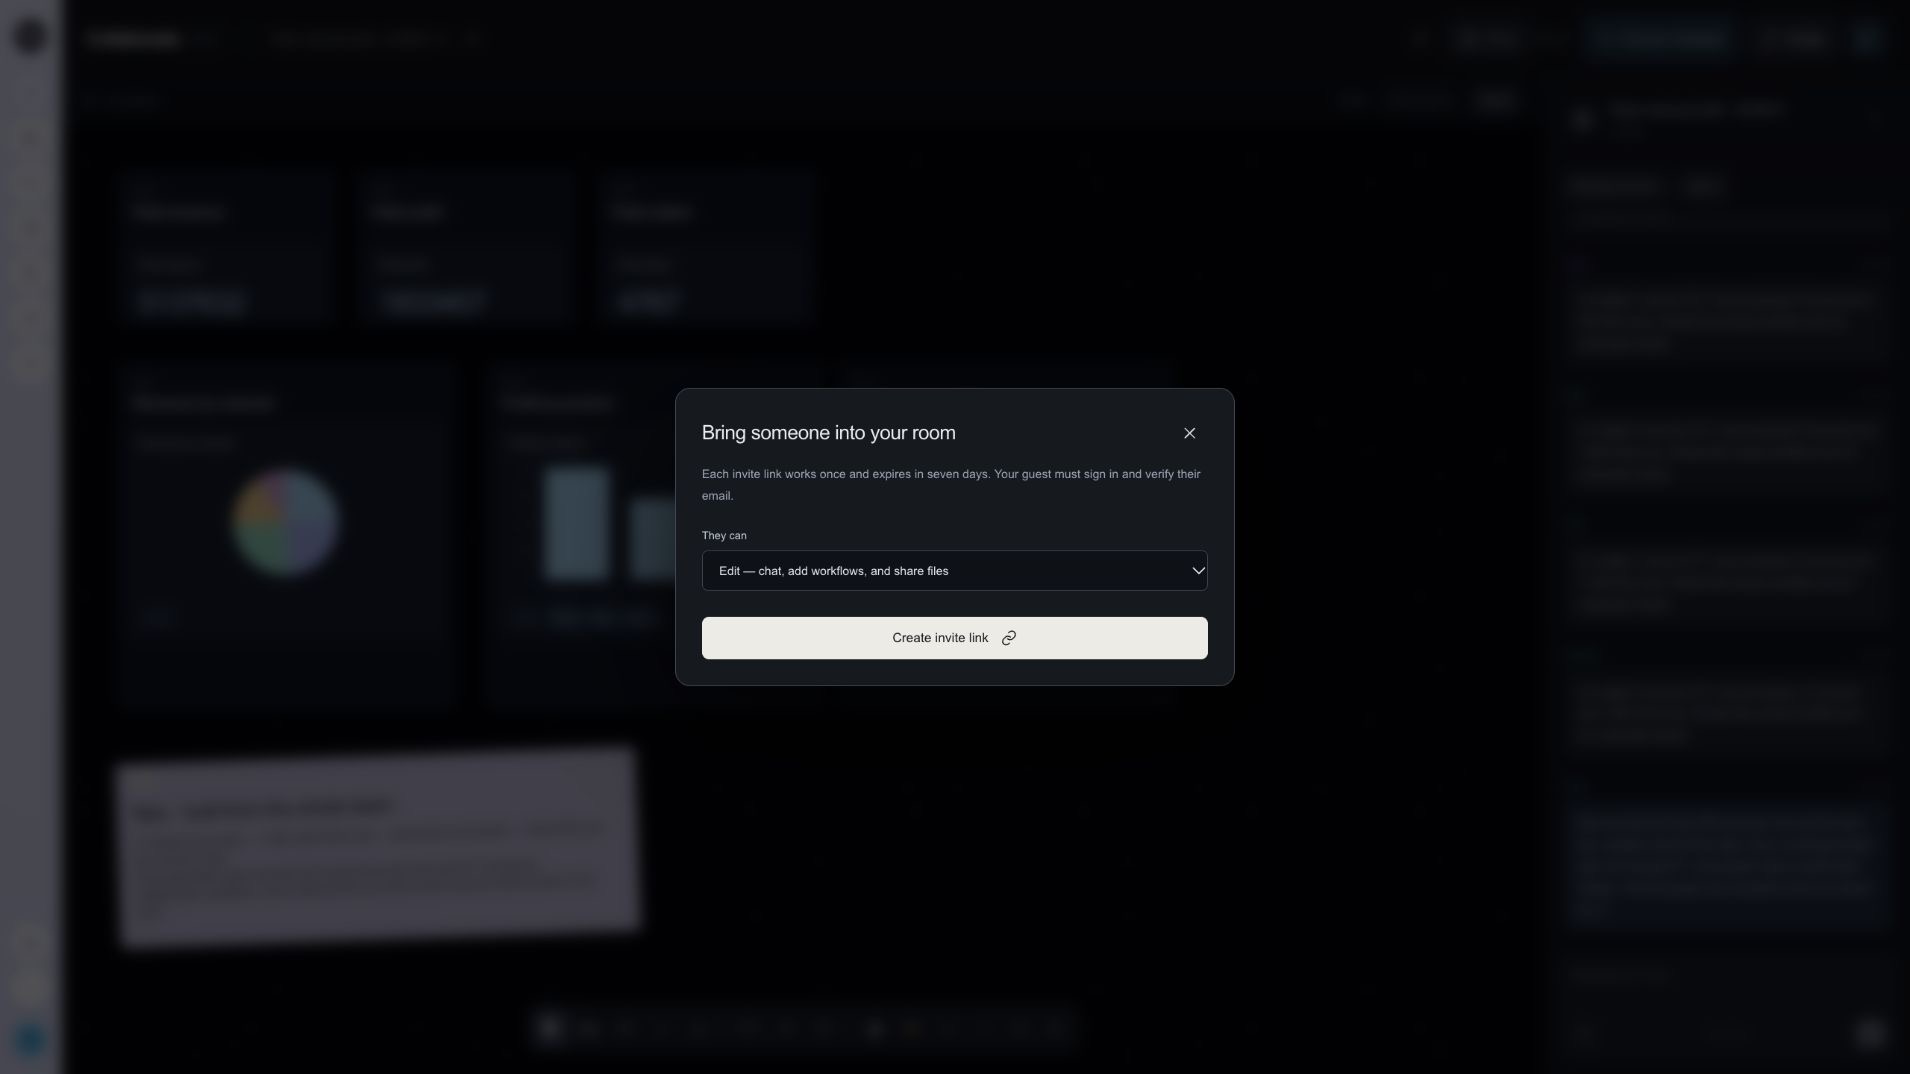
Watch exampleInvite teammates with expiring links and give them editor or viewer access.
Watch exampleSee who has access and which role each person has.
Watch exampleCapture ideas and edit text on a shared board.
Watch examplePage through shared PDFs on the board.
Watch exampleSave board edits explicitly or let the connected browser save them.
Watch exampleResume a browser session and keep unsent work through reauthentication.
Watch examplePlace rectangles, ellipses, and diamonds around ideas.
Watch exampleInspect shared vector images on the board.
Watch exampleStep backward or forward through your board edits.
Watch exampleTry a relevant next breakdown or filter directly from an answer.
Watch example19 features
Profile datasets and surface data quality issues.
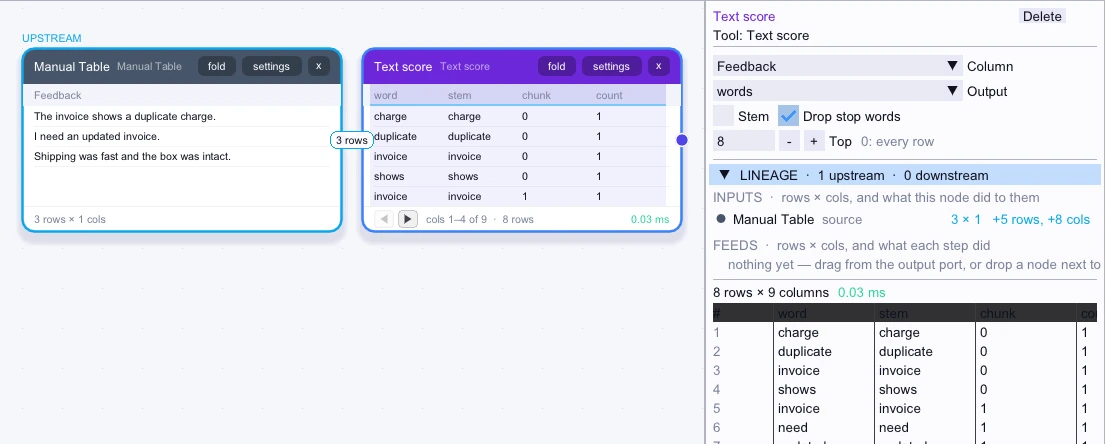
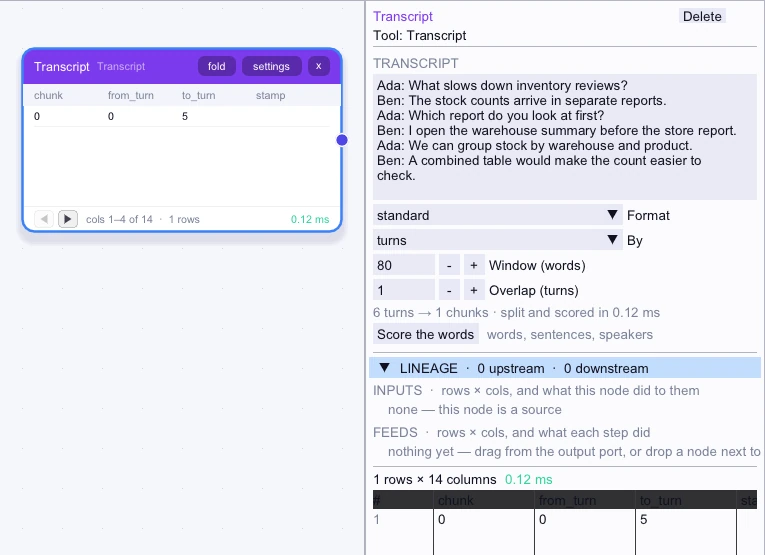
Watch exampleScore words, sentences, or speakers from a text column.
Canvas nodeSee workflowsReview the steps and relationships discussed in a meeting.
Watch exampleReview checked topic categories and open their source passages in Rug.
Watch exampleTurn meeting text into rows for Canvas and discover the Rug boards you can generate from the same transcript.
Canvas nodeSee workflowsSee which requests have a separate, linked promise to act.
Watch exampleChoose C++-first or model-led planning for checked topic diagrams.
Watch exampleImport meeting text to create a source map and word network, with optional topic diagrams.
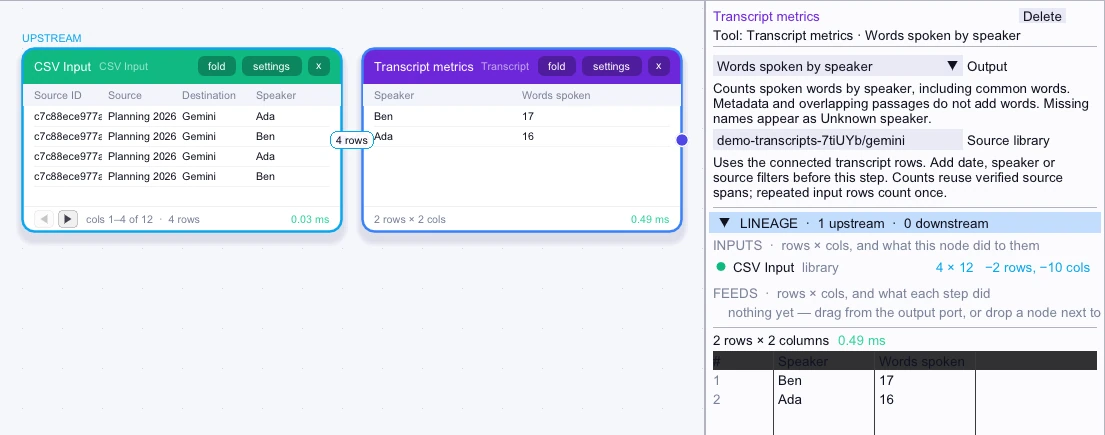
Watch exampleAnalyze speaker word counts, vocabulary, language cues, and meeting totals.
Canvas nodeSee workflowsTurn checked requests from a meeting into an editable Rug board.
Watch exampleBrowse original speaker turns in an editable Rug diagram.
Watch exampleChoose which transcripts feed the collection workflow.
Watch exampleSelect a term to see its exact quotes, speakers, and recording times.
Watch exampleChoose the vocabulary and terms to show in a transcript word network.
Watch exampleVisualize word relationships alongside source excerpts.
Watch exampleCompare terms over speaking time and inspect original passages.
Watch exampleFind saved meetings, source evidence, and checked diagrams.
AppWatch exampleExplore grouped or hierarchical values.
Watch exampleSwitch a diagram between vertical and horizontal flow.
Watch example4 features
Remove the assistant's last workflow build from Canvas.
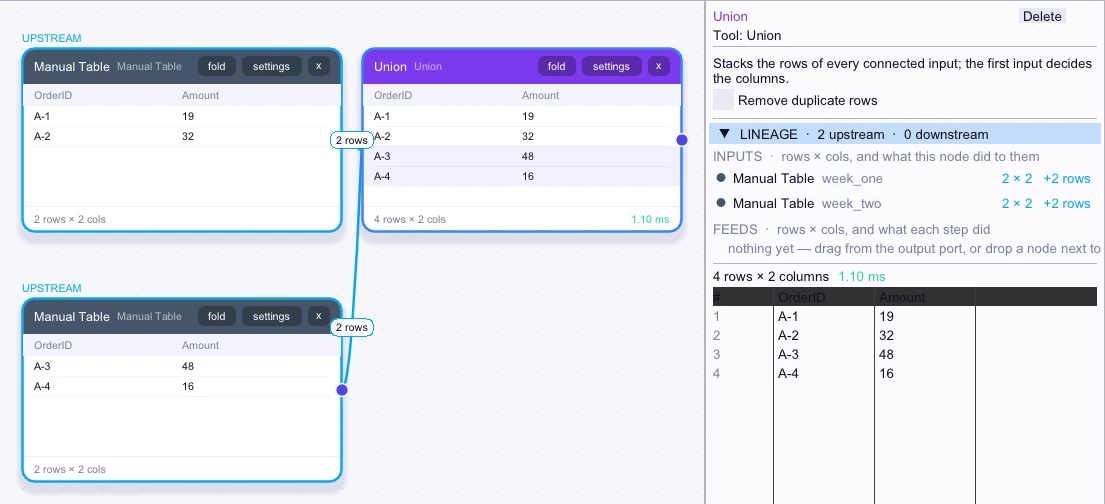
Watch exampleStack rows from several inputs with optional deduplication.
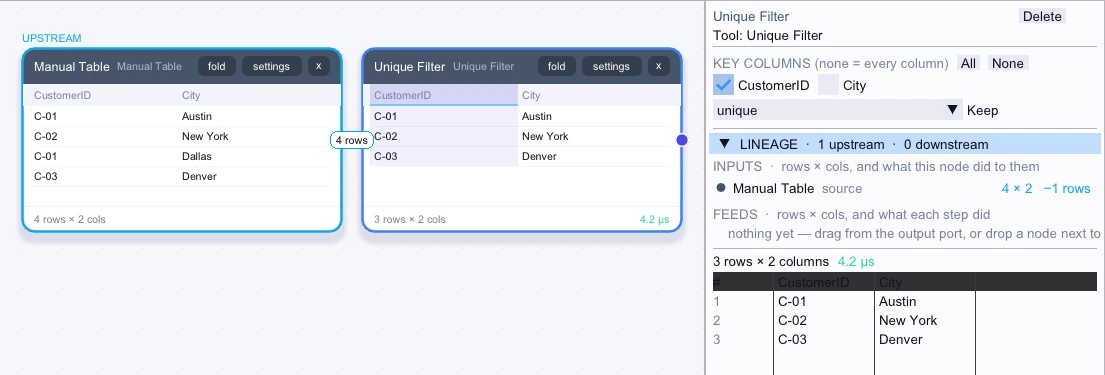
Canvas nodeSee workflowsKeep the first row for each key or isolate subsequent repeats.
Canvas nodeSee workflowsSimplify the vocabulary network to inspect related terms.
Watch example2 features
Save editable vector geometry and text in SVG.
Watch exampleCreate an account, verify your email, and sign in with a password.
Watch example9 features
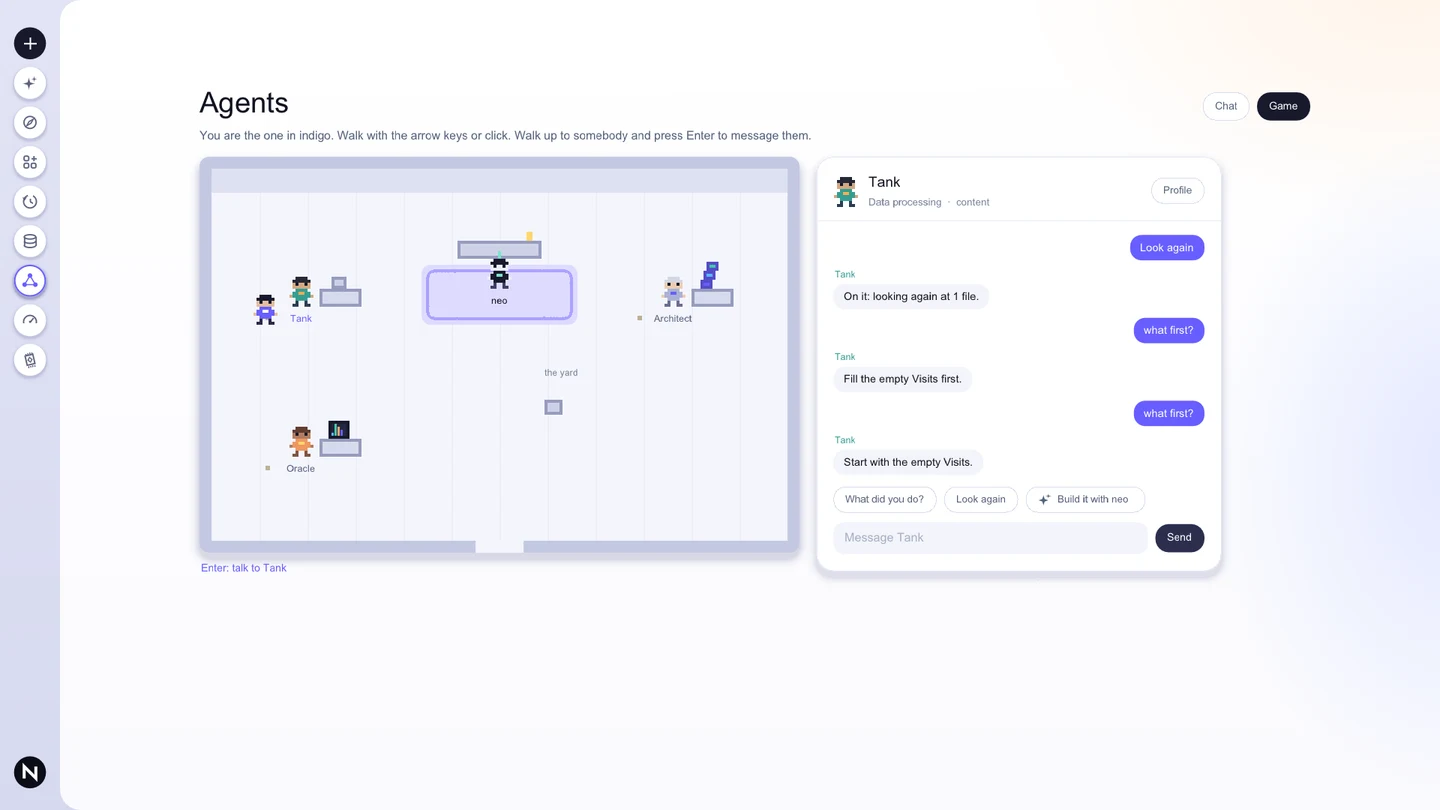
Move through rooms and walk up to an agent to open its chat.
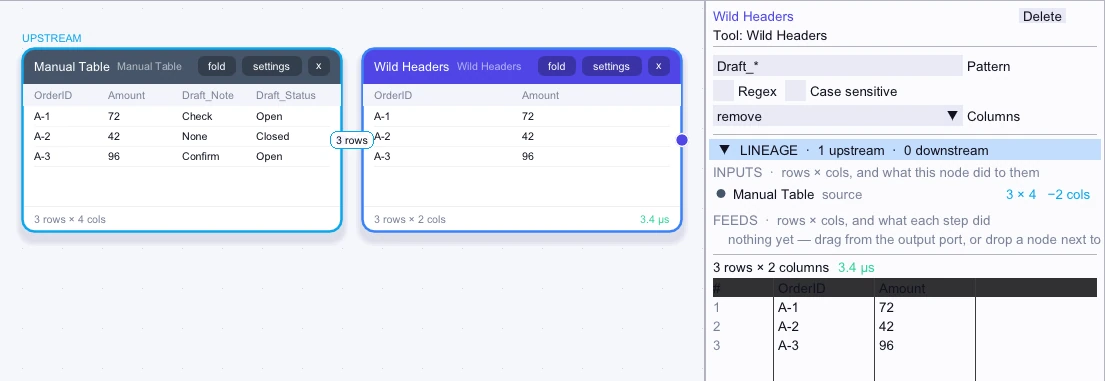
Watch exampleKeep or remove columns by matching their headers against a pattern.
Canvas nodeSee workflowsDrop a wire on empty Canvas to add and connect the next step.
Watch exampleBrowse work you own and work shared with you across studios.
Watch exampleReview workflow saves, writes, and errors.
Watch exampleChoose how to save, check status, and retry a save.
Watch exampleSee which steps feed a result and which downstream steps use it.
Watch exampleCreate, rename, duplicate, and move pipelines into groups.
Watch exampleFind a saved pipeline by its purpose, data, or steps.
Watch example2 features
15 features
18 features
38 features
6 features
14 features
10 features
11 features
10 features
19 features
26 features
6 features
15 features
10 features
6 features
4 features
5 features