Canvas nodes
Date Bucket
Group dates by week, month, quarter, or year.
How it works
Choose a date field and a week, month, quarter, or year. The node adds a bucket column that you can use to group rows.
Simple example
Connect orders with an Order Date column and choose Month in Date Bucket. The output adds a month label to each order that you can group on in Aggregate.
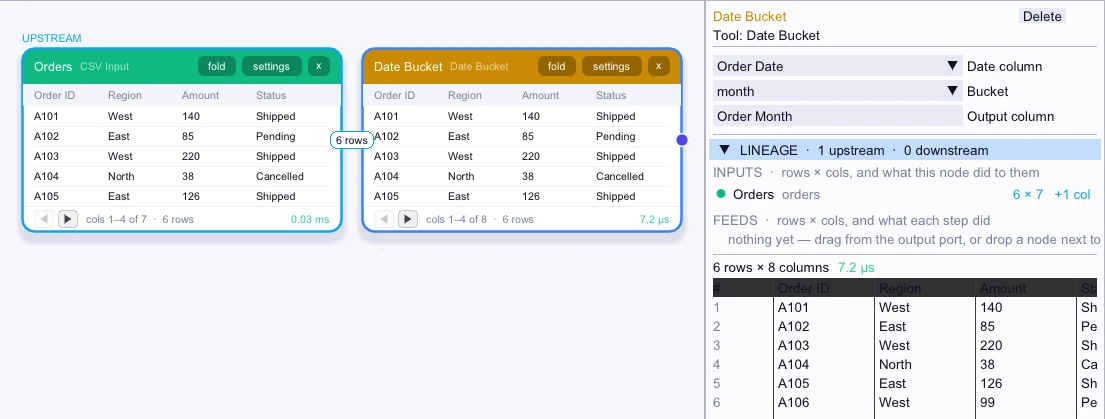
Input
First 5 of 6 rows| Order ID | Region | Amount | Status | Customer ID | Reference |
|---|---|---|---|---|---|
| A101 | West | 140 | Shipped | C1 | Retail |
| A102 | East | 85 | Pending | C2 | Outlet |
| A103 | West | 220 | Shipped | C3 | Retail |
| A104 | North | 38 | Cancelled | C9 | Retail |
| A105 | East | 126 | Shipped | C2 | Outlet |
Node output
First 5 of 6 rows| Order ID | Region | Amount | Status | Reference | Order Month |
|---|---|---|---|---|---|
| A101 | West | 140 | Shipped | Retail | 2026-10 |
| A102 | East | 85 | Pending | Outlet | 2026-10 |
| A103 | West | 220 | Shipped | Retail | 2026-11 |
| A104 | North | 38 | Cancelled | Retail | 2026-11 |
| A105 | East | 126 | Shipped | Outlet | 2026-11 |
Complex workflow
Choose Quarter for Order Date and name the new field Reporting Quarter. Group by Reporting Quarter and Region in Aggregate to compare regional results across quarters. The labels include the year, so the same quarter in two different years stays separate.
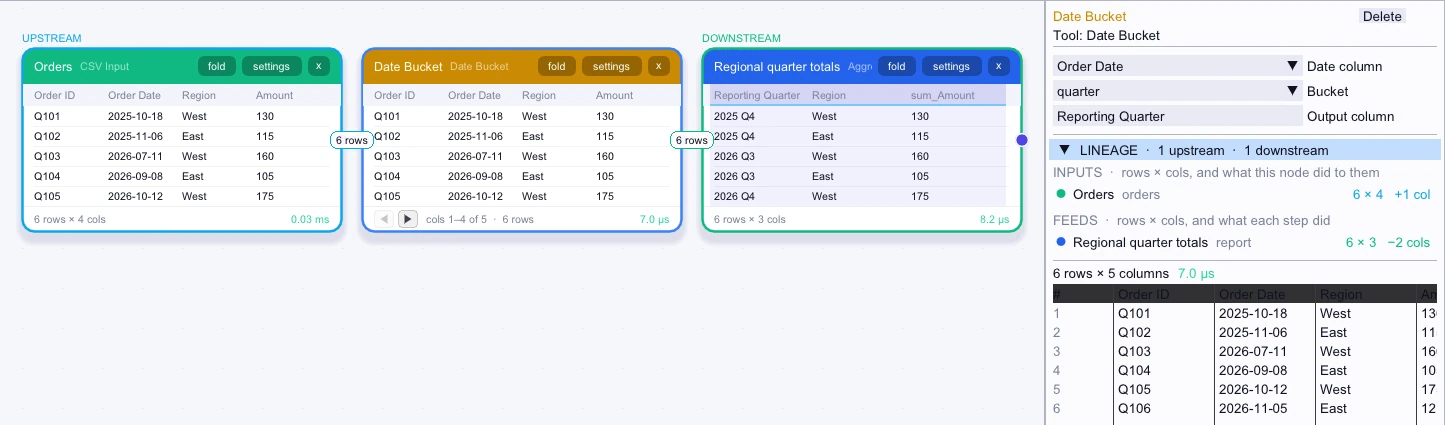
Input
First 5 of 6 rows| Order ID | Order Date | Region | Amount |
|---|---|---|---|
| Q101 | 2025-10-18 | West | 130 |
| Q102 | 2025-11-06 | East | 115 |
| Q103 | 2026-07-11 | West | 160 |
| Q104 | 2026-09-08 | East | 105 |
| Q105 | 2026-10-12 | West | 175 |
Node output
First 5 of 6 rows| Order ID | Order Date | Region | Amount | Reporting Quarter |
|---|---|---|---|---|
| Q101 | 2025-10-18 | West | 130 | 2025 Q4 |
| Q102 | 2025-11-06 | East | 115 | 2025 Q4 |
| Q103 | 2026-07-11 | West | 160 | 2026 Q3 |
| Q104 | 2026-09-08 | East | 105 | 2026 Q3 |
| Q105 | 2026-10-12 | West | 175 | 2026 Q4 |
Workflow result
First 5 of 6 rows| Reporting Quarter | Region | sum_Amount |
|---|---|---|
| 2025 Q4 | West | 130 |
| 2025 Q4 | East | 115 |
| 2026 Q3 | West | 160 |
| 2026 Q3 | East | 105 |
| 2026 Q4 | West | 175 |