Canvas nodes
Dashboard filters
Filter dashboard charts together and apply the same selections to connected workflow steps.
How it works
Add fields using the dashboard filter controls and choose values or ranges. The connected branch recomputes from those selections, so its charts use the same filtered rows.
Simple example
Connect the same Dashboard filters node upstream of two sales charts. Add Region as a filter and select West. Both downstream charts update to use the West rows.
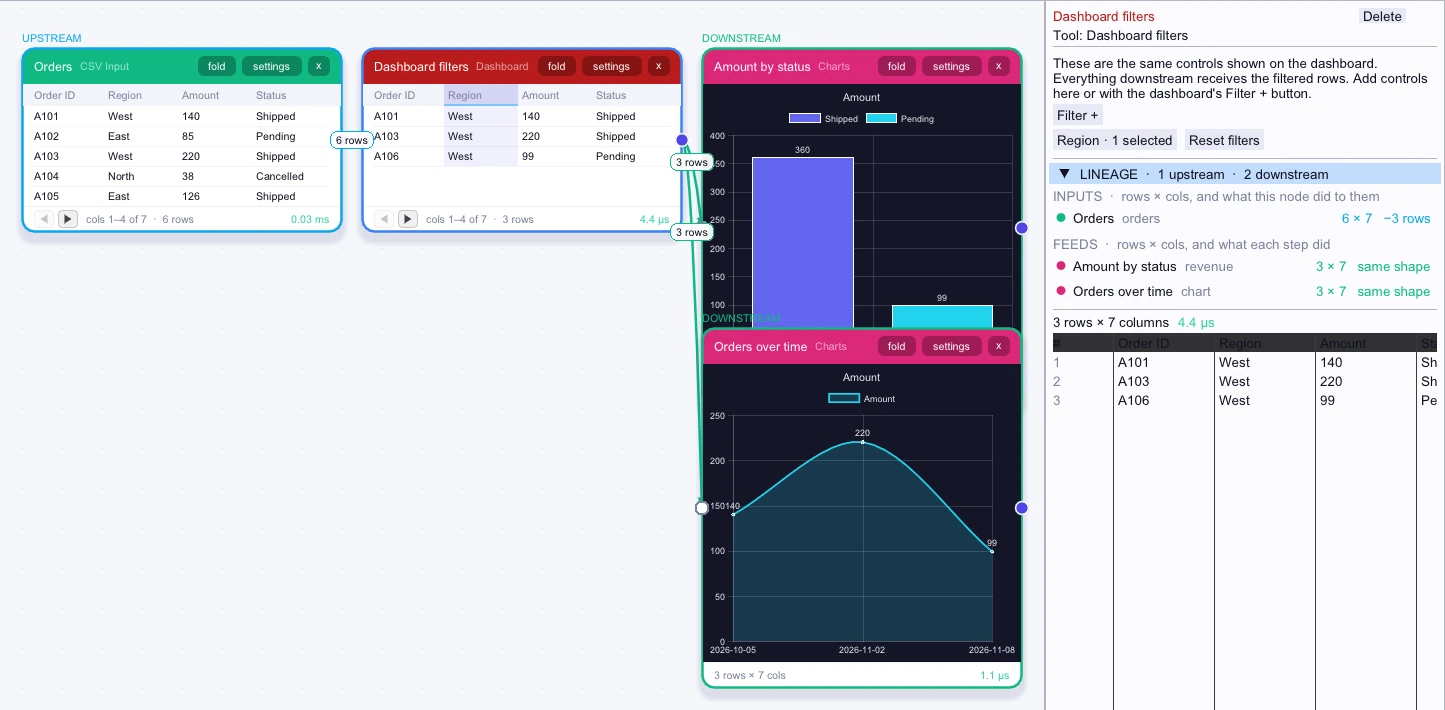
Input
First 5 of 6 rows| Order ID | Region | Amount | Status | Customer ID | Reference |
|---|---|---|---|---|---|
| A101 | West | 140 | Shipped | C1 | Retail |
| A102 | East | 85 | Pending | C2 | Outlet |
| A103 | West | 220 | Shipped | C3 | Retail |
| A104 | North | 38 | Cancelled | C9 | Retail |
| A105 | East | 126 | Shipped | C2 | Outlet |
Node output
3 rows| Order ID | Region | Amount | Status | Customer ID | Reference |
|---|---|---|---|---|---|
| A101 | West | 140 | Shipped | C1 | Retail |
| A103 | West | 220 | Shipped | C3 | Retail |
| A106 | West | 99 | Pending | C1 | Retail |
Complex workflow
Put Dashboard filters upstream of the aggregations that feed a revenue chart and an order-count card. Choose several Region values and a range on the Order Date field. Both summaries calculate from rows that satisfy the combined selections.
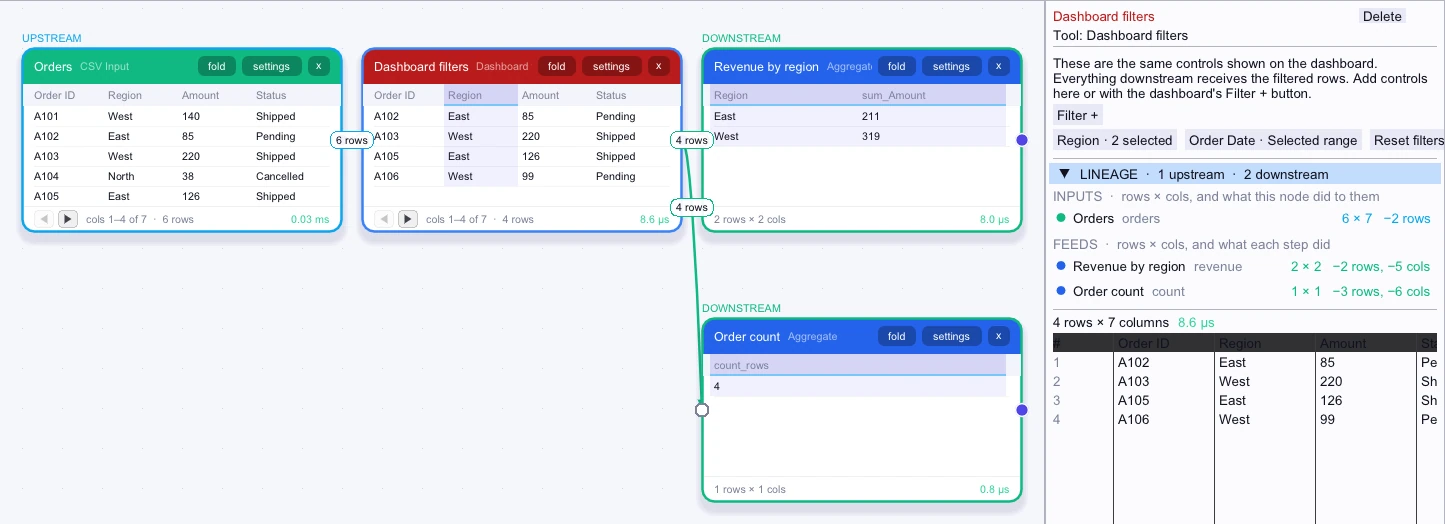
Input
First 5 of 6 rows| Order ID | Region | Amount | Status | Customer ID | Reference |
|---|---|---|---|---|---|
| A101 | West | 140 | Shipped | C1 | Retail |
| A102 | East | 85 | Pending | C2 | Outlet |
| A103 | West | 220 | Shipped | C3 | Retail |
| A104 | North | 38 | Cancelled | C9 | Retail |
| A105 | East | 126 | Shipped | C2 | Outlet |
Node output
4 rows| Order ID | Region | Amount | Status | Customer ID | Reference |
|---|---|---|---|---|---|
| A102 | East | 85 | Pending | C2 | Outlet |
| A103 | West | 220 | Shipped | C3 | Retail |
| A105 | East | 126 | Shipped | C2 | Outlet |
| A106 | West | 99 | Pending | C1 | Retail |
Workflow result
2 rows| Region | sum_Amount |
|---|---|
| East | 211 |
| West | 319 |
Workflow result
1 row| count_rows |
|---|
| 4 |