Canvas nodes
Charts
Turn pipeline data into charts, trees, or KPI cards.
How it works
Connect a table and choose a visualization. Set the fields to plot or calculate, then see the result on the node and in its workflow dashboard.
Simple example
Connect regional sales totals to a Charts node and choose Bar. Set Region as the dimension and Total Amount as the measure to compare sales across regions.
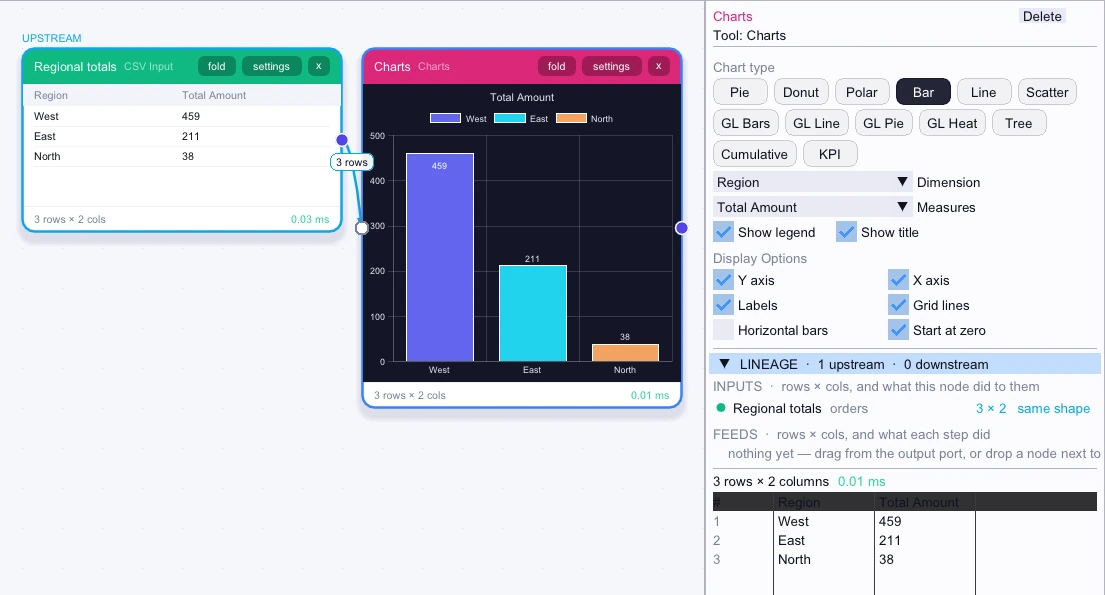
Input
3 rows| Region | Total Amount |
|---|---|
| West | 459 |
| East | 211 |
| North | 38 |
Node output
3 rows| Region | Total Amount |
|---|---|
| West | 459 |
| East | 211 |
| North | 38 |
Complex workflow
Build a daily sales summary with Date Bucket or a date column and Aggregate. Use Charts with Line selected, Date as the dimension, and Total Amount as the measure. Open the workflow dashboard to see the trend beside other chart nodes from the same workflow.
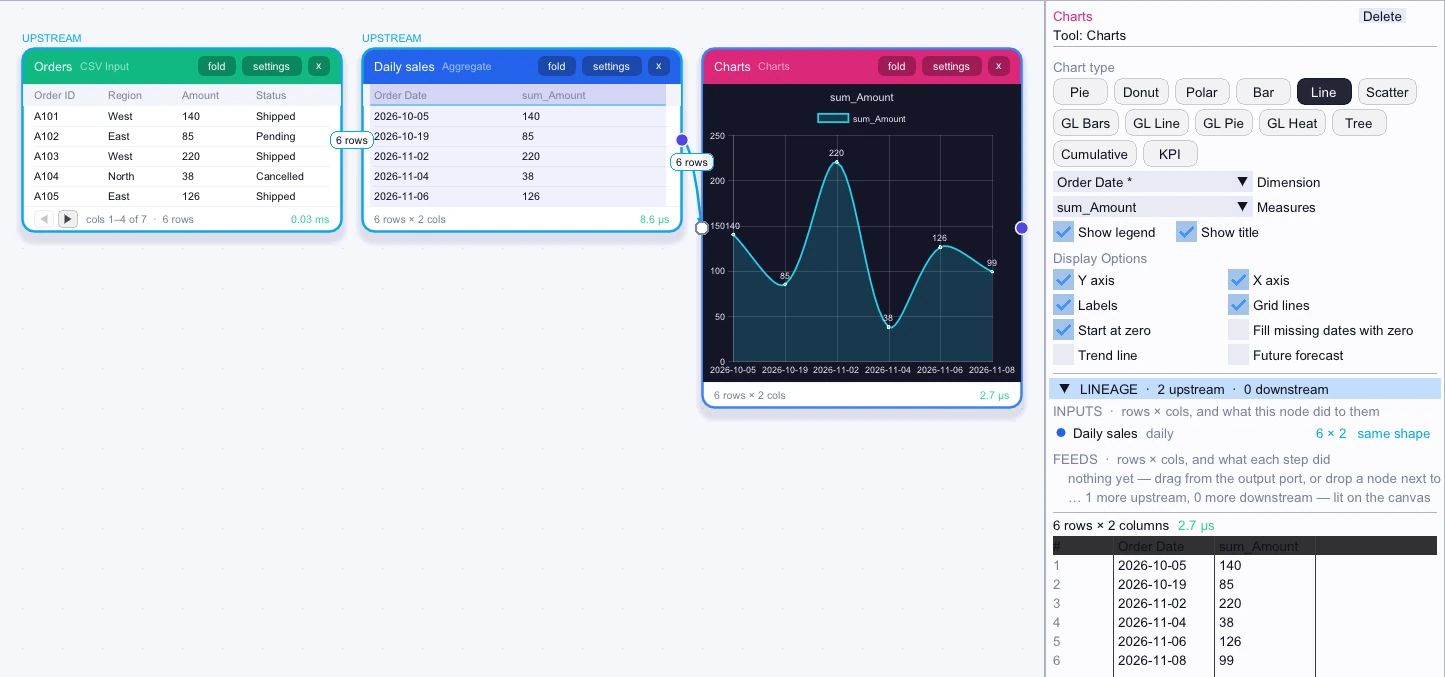
Input
First 5 of 6 rows| Order Date | sum_Amount |
|---|---|
| 2026-10-05 | 140 |
| 2026-10-19 | 85 |
| 2026-11-02 | 220 |
| 2026-11-04 | 38 |
| 2026-11-06 | 126 |
Node output
First 5 of 6 rows| Order Date | sum_Amount |
|---|---|
| 2026-10-05 | 140 |
| 2026-10-19 | 85 |
| 2026-11-02 | 220 |
| 2026-11-04 | 38 |
| 2026-11-06 | 126 |