Chart formats
Cumulative charts
Follow totals as they accumulate over a series.
How it works
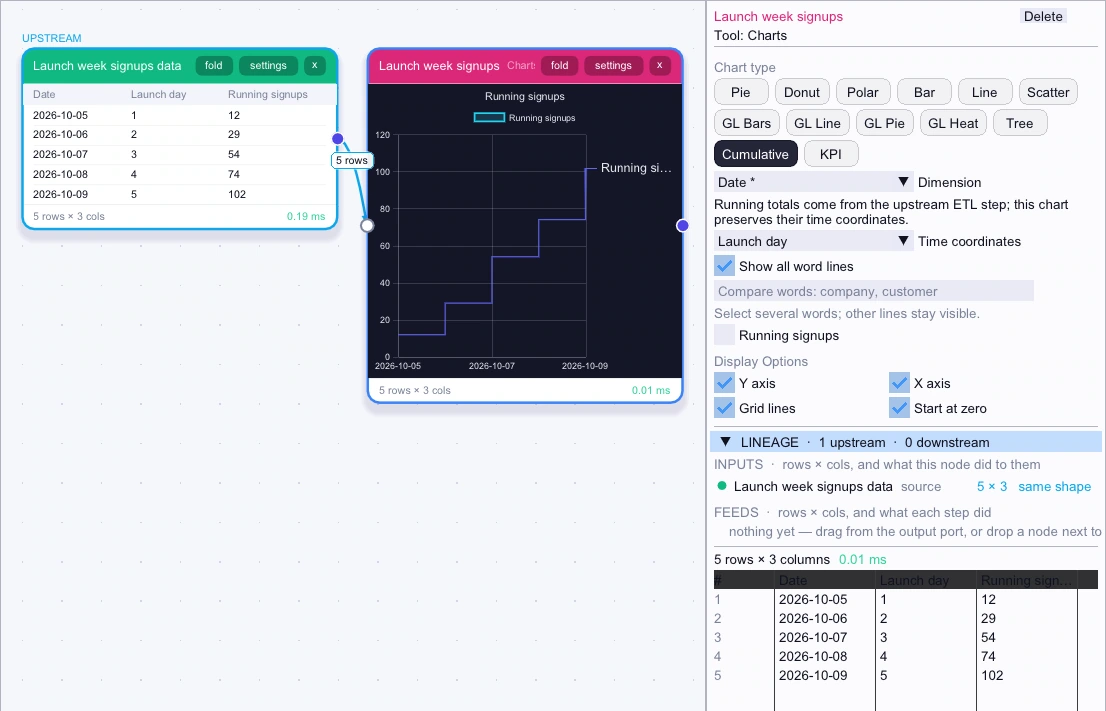
Connect the launch signup table to Charts. In its settings choose Cumulative, set the dimension to Date, use Launch day for the numeric position, and choose Running signups as the measure. Open Dashboards to follow the running total.
Example
| Date | Launch day | Running signups |
|---|---|---|
| 2026-10-05 | 1 | 12 |
| 2026-10-06 | 2 | 29 |
| 2026-10-07 | 3 | 54 |
| 2026-10-08 | 4 | 74 |
| 2026-10-09 | 5 | 102 |
- Start with
Load the dates, launch day numbers, and running signup totals.
- Try this
Choose Cumulative and plot Running signups against Launch day.
- Result
The step line climbs from 12 to 102 signups.