Chart formats
Polar area charts
Compare values with equal-angle sectors of varying radius.
How it works
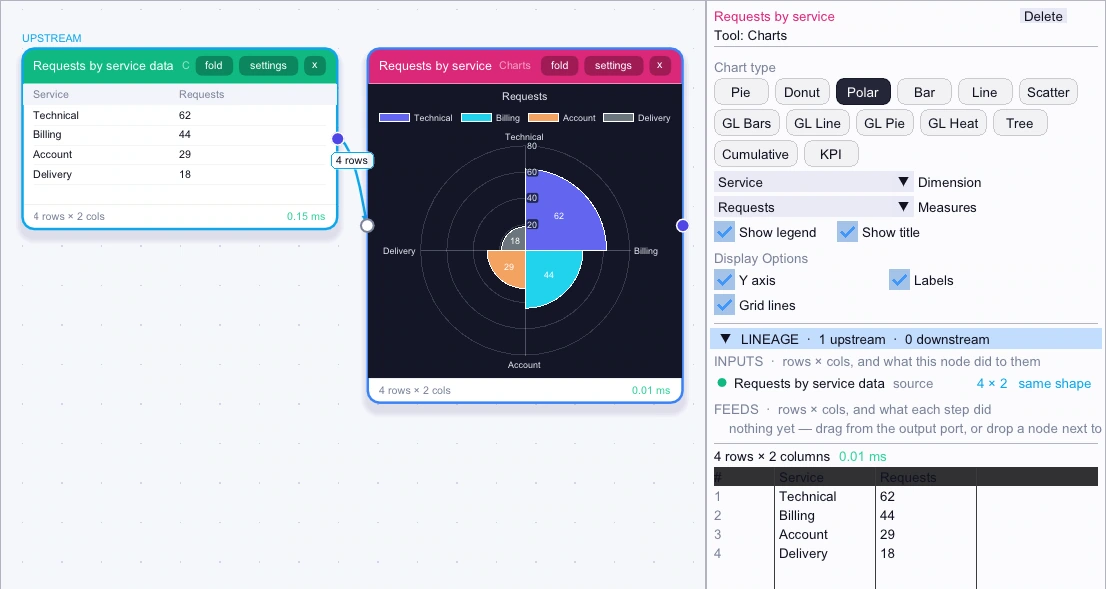
In Canvas, connect CSV Input to Charts. Open the Charts settings, choose Polar, set Dimension to Service and Measures to Requests, then open Dashboards. Every service gets the same angle, and higher counts extend farther from the center.
Example
| Service | Requests |
|---|---|
| Technical | 62 |
| Billing | 44 |
| Account | 29 |
| Delivery | 18 |
- Start with
Load Service and Requests from the sample table.
- Try this
Choose Polar, with Service as the dimension and Requests as the measure.
- Result
Technical extends farthest at 62 requests. Delivery is shortest at 18.