Canvas nodes
Pivot
Turn distinct values into columns and summarize each group.
How it works
Choose the fields that define rows and the field whose values should become columns. Select an aggregation to fill the resulting grid.
Simple example
Set Product as the row field and Channel as the source of new columns, then choose Count. The output has a row per product and a count for each sales channel.
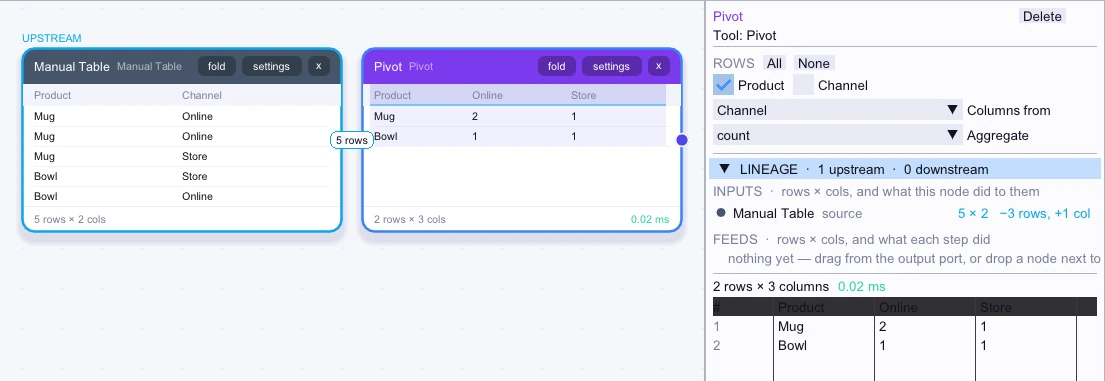
Input
5 rows| Product | Channel |
|---|---|
| Mug | Online |
| Mug | Online |
| Mug | Store |
| Bowl | Store |
| Bowl | Online |
Node output
2 rows| Product | Online | Store |
|---|---|---|
| Mug | 2 | 1 |
| Bowl | 1 | 1 |
Complex workflow
Filter to paid orders, then pivot by Region and Product with Channel as the column field. Sum Amount in each cell to compare paid sales across channels for the same region and product.
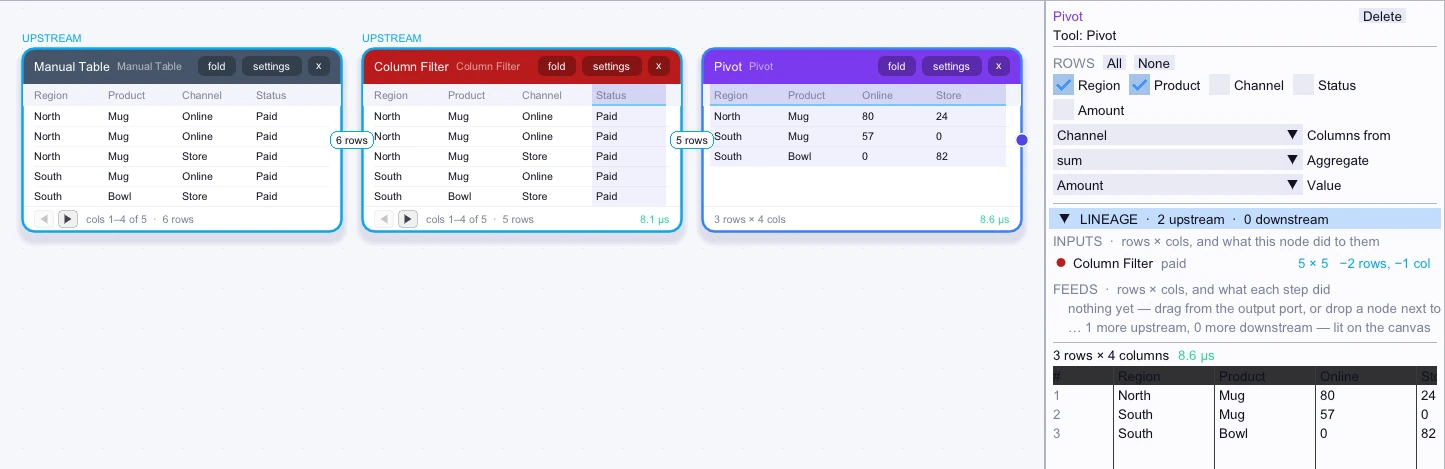
Input
5 rows| Region | Product | Channel | Status | Amount |
|---|---|---|---|---|
| North | Mug | Online | Paid | 32 |
| North | Mug | Online | Paid | 48 |
| North | Mug | Store | Paid | 24 |
| South | Mug | Online | Paid | 57 |
| South | Bowl | Store | Paid | 82 |
Node output
3 rows| Region | Product | Online | Store |
|---|---|---|---|
| North | Mug | 80 | 24 |
| South | Mug | 57 | 0 |
| South | Bowl | 0 | 82 |