Canvas nodes
Manual Table
Enter data directly in an editable grid.
How it works
Type values into the grid and name its columns. Connect the hand-entered rows to another node, such as a join with your main dataset.
Simple example
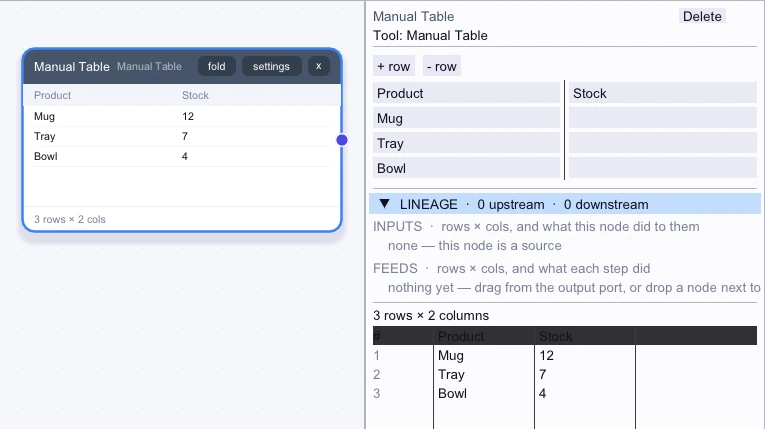
Enter Product and Stock columns, then type the counts from a shelf check. The grid becomes a two-column table you can use in Canvas.
Loaded rows
3 rows| Product | Stock |
|---|---|
| Mug | 12 |
| Tray | 7 |
| Bowl | 4 |
Complex workflow
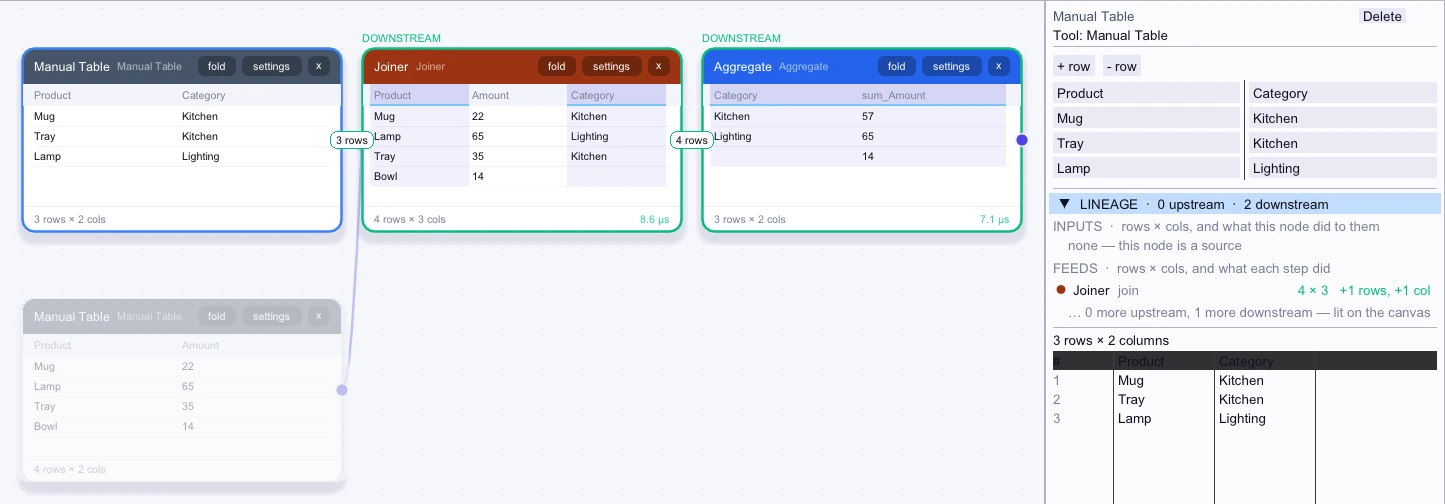
Enter a small product-to-category lookup in Manual Table. Connect it and an orders table to a left Joiner on Product so the orders gain a Category column, then total Amount by category.
Loaded rows
3 rows| Product | Category |
|---|---|
| Mug | Kitchen |
| Tray | Kitchen |
| Lamp | Lighting |
Workflow result
3 rows| Category | sum_Amount |
|---|---|
| Kitchen | 57 |
| Lighting | 65 |
| — | 14 |