Canvas nodes
Aggregate
Group rows by category and calculate summaries.
How it works
Choose one or more grouping columns and add calculations such as sum, average, or count. Each group becomes one summary row.
Simple example
Connect an orders table to Aggregate. In Group by, select Region, then add Sum as the measure for Amount. The output has one row per region with its total order amount.
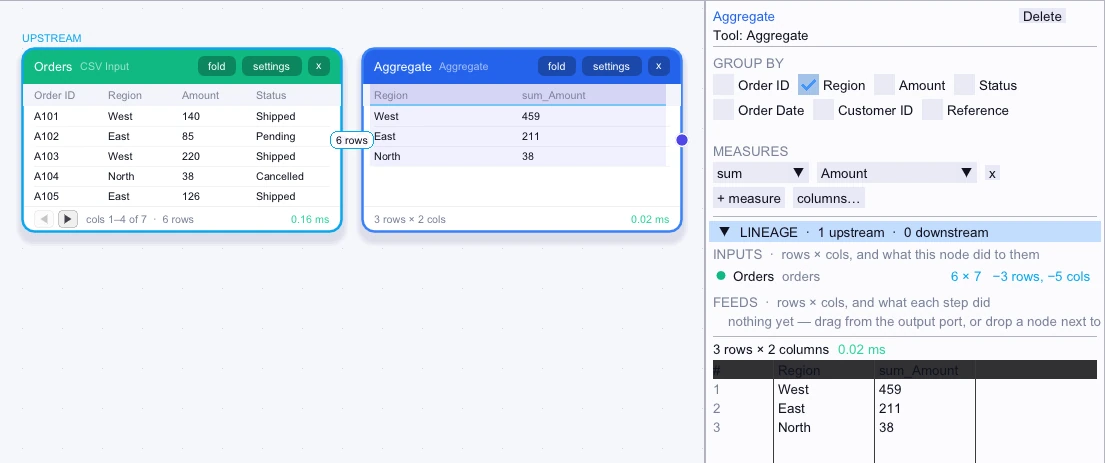
Input
First 5 of 6 rows| Order ID | Region | Amount | Status | Customer ID | Reference |
|---|---|---|---|---|---|
| A101 | West | 140 | Shipped | C1 | Retail |
| A102 | East | 85 | Pending | C2 | Outlet |
| A103 | West | 220 | Shipped | C3 | Retail |
| A104 | North | 38 | Cancelled | C9 | Retail |
| A105 | East | 126 | Shipped | C2 | Outlet |
Node output
3 rows| Region | sum_Amount |
|---|---|
| West | 459 |
| East | 211 |
| North | 38 |
Complex workflow
Use Date Bucket to add Order Month to the orders table. Group by Order Month and Region in Aggregate, then add Sum of Amount, Average of Amount, and Count as measures. Send the monthly totals, average order amounts, and order counts to a dashboard or export.
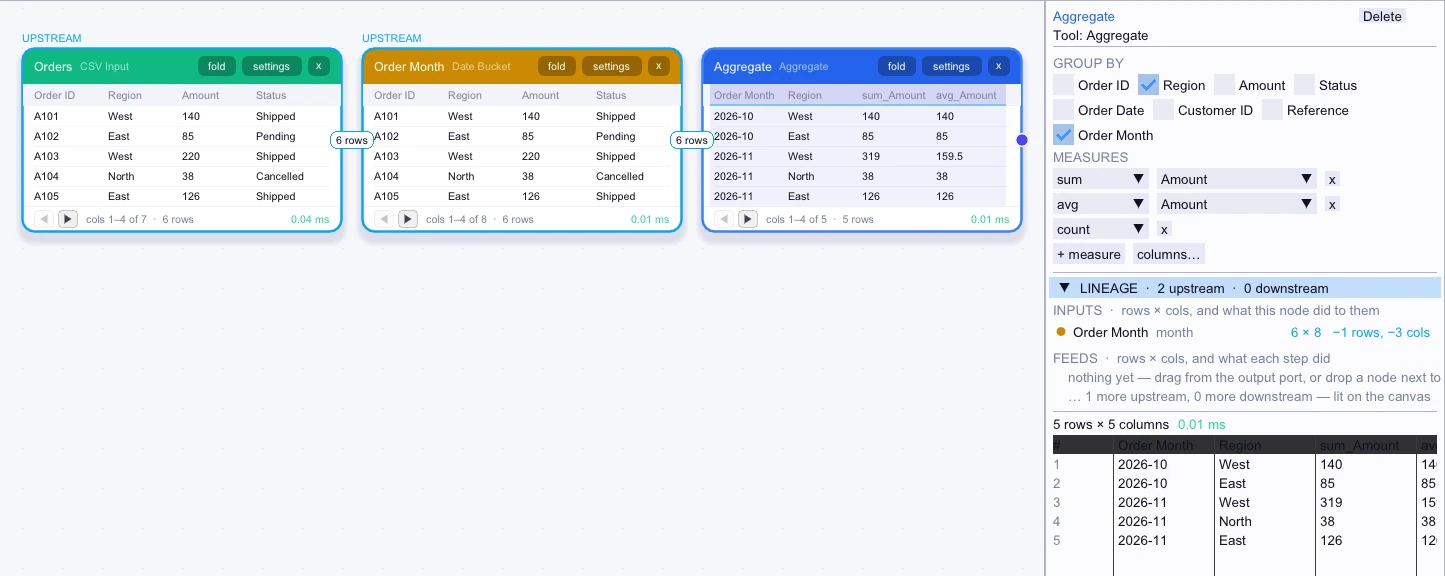
Input
First 5 of 6 rows| Order ID | Region | Amount | Status | Reference | Order Month |
|---|---|---|---|---|---|
| A101 | West | 140 | Shipped | Retail | 2026-10 |
| A102 | East | 85 | Pending | Outlet | 2026-10 |
| A103 | West | 220 | Shipped | Retail | 2026-11 |
| A104 | North | 38 | Cancelled | Retail | 2026-11 |
| A105 | East | 126 | Shipped | Outlet | 2026-11 |
Node output
5 rows| Order Month | Region | sum_Amount | avg_Amount | count_rows |
|---|---|---|---|---|
| 2026-10 | West | 140 | 140 | 1 |
| 2026-10 | East | 85 | 85 | 1 |
| 2026-11 | West | 319 | 159.5 | 2 |
| 2026-11 | North | 38 | 38 | 1 |
| 2026-11 | East | 126 | 126 | 1 |
Related research
- Measuring filters, sorts, and grouped sums
See how the work included in each measurement changes the comparison.