Canvas nodes
Excel Output
Export a pipeline table as an Excel workbook.
How it works
Connect a pipeline result to Excel Output and export it as an .xlsx workbook. This gives reviewers a spreadsheet copy of the computed table.
Simple example
Connect an inventory table to Excel Output and choose Export. Open the resulting .xlsx file to review the table in a single worksheet named Data.
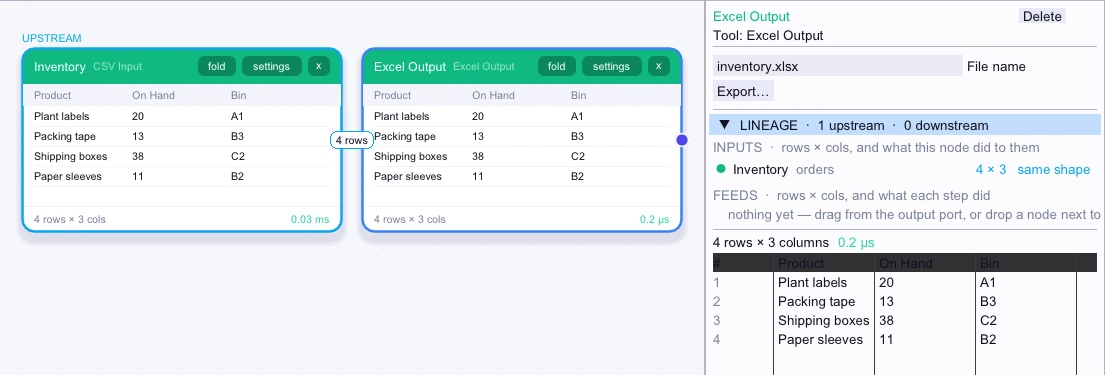
Rows exported
4 rows| Product | On Hand | Bin |
|---|---|---|
| Plant labels | 20 | A1 |
| Packing tape | 13 | B3 |
| Shipping boxes | 38 | C2 |
| Paper sleeves | 11 | B2 |
Complex workflow
Start with a regional sales summary and use Column Renamer to order and label its report columns. Connect the revised table to Excel Output and export a workbook that a colleague can open and continue working with in Excel.
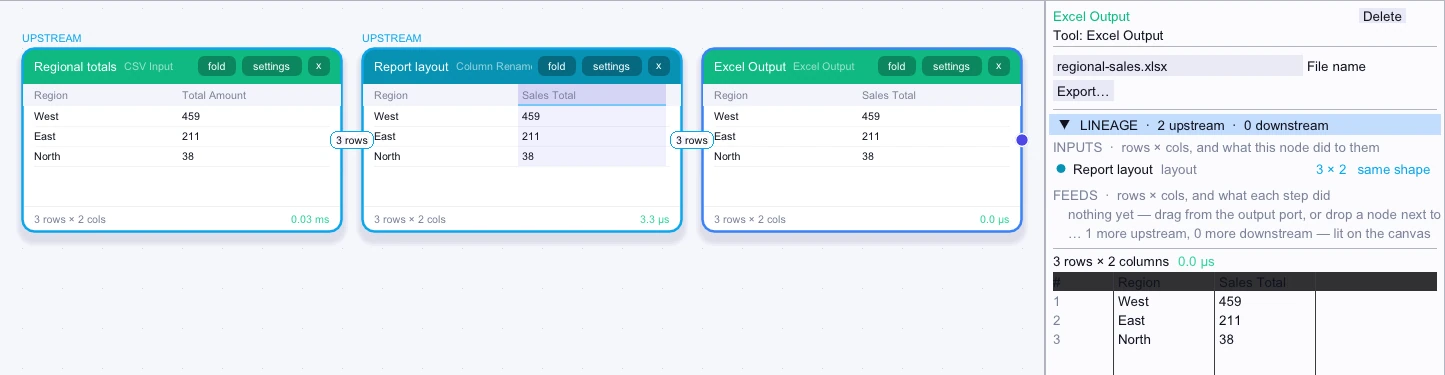
Rows exported
3 rows| Region | Sales Total |
|---|---|
| West | 459 |
| East | 211 |
| North | 38 |